Download
1 / 27
270 likes | 296 Views
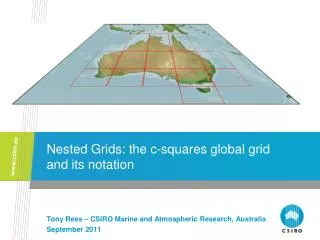
C-Squares grid system for spatial data indexing, mapping, and analysis. Enhance visibility, global views, and land masking options. Explore polar regions and new features with optimized globe views. Try it via OBIS species pages or directly with code. Development credits to Tony Rees, Miroslaw Ryba, Philip Bohm, and Hari Nair.

E N D
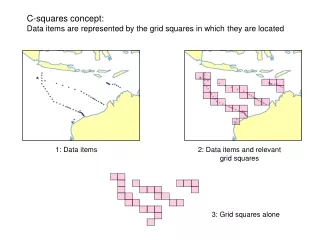
C-squares concept:Data items are represented by the grid squares in which they are located 1: Data items 2: Data items and relevant grid squares 3: Grid squares alone
Principal purpose of c-squares is for spatial indexing and spatial queries - secondary application is for mapping - another is for data aggregation, e.g. for analysis, reporting, exchange - can also be efficient: e.g. in OBIS case, map <2,000 squares rather than 50,000 data points for one species (over 95% faster) - or, map 70,000 squares rather than 9 million points (all the data...) OBIS data – “all vertebrates” (3.4 million records) ...
First c-squares mapper constructed at CMAR, Hobart in early 2002 – used by CMAR applications, OBIS, FishBase and Cephbase • Mapper upgraded (v2) in 2003 – to map multiple sets of squares concurrently, and support “click on map” functionality (e.g. to do a “get the data” query) • Minor upgrades in 2004/5 to suit needs of AquaMaps project, also ported to faster machine at CMAR, Hobart (20x speed increase...) • Mapper installation replicated at IfM-GEOMAR (Germany), and Swedish Museum of Natural History, in 2005/6, for FishBase/AquaMaps and INCOFISH project use
Jan-May 2006: Mapper upgraded (v3) to use more detailed graphics (supporting seamless pan and zoom across the entire world), better seabed detail, more realistic land images • New “globe views” introduced (with new graphical user interface to spin the globe around), based on Hari Nair’s “Xplanet” software • Squares can be enhanced for extra visibility (“bold” or “intermediate”), or plotted at fine scale as desired • Land masking is available on globe views and all derived maps • Gridlines have been added to maps based on “globe views” to help user orientation • Maps based on globe views have more “correct” representation of proportion when zoomed in, also supports polar views (ideal for plotting Arctic, Antarctic data) • Quite a bit of background optimization to minimise redraw wait times, etc. once globe views have been created.
Globe views available from all “world” maps – continuously tiltable and rotateable
Globe views available from all “world” maps – continuously tiltable and rotateable
Globe views available from all “world” maps – continuously tiltable and rotateable
Globe views available from all “world” maps – continuously tiltable and rotateable
Globe views available from all “world” maps – continuously tiltable and rotateable
Globe views available from all “world” maps – continuously tiltable and rotateable
Globe views available from all “world” maps – continuously tiltable and rotateable
Globe views available from all “world” maps – continuously tiltable and rotateable
Globe views available from all “world” maps – continuously tiltable and rotateable
Globe views available from all “world” maps – continuously tiltable and rotateable
Globe views available from all “world” maps – continuously tiltable and rotateable
Globe views available from all “world” maps – continuously tiltable and rotateable
Globe views available from all “world” maps – continuously tiltable and rotateable
Globe views available from all “world” maps – continuously tiltable and rotateable
Ability to view polar regions – with / without ice cover, as preferred
Ability to view polar regions – with / without ice cover, as preferred
Ability to view polar regions – with / without ice cover, as preferred
Land mask available for all new maps Land mask off (all current OBIS fish data) Land mask on
Three ways to try out the new features: • Via any OBIS species page, or “group” clickable map • Direct call to mapper with a suitable c-square code or codes, e.g. http://www.obis.org.au/cgi-bin/cs_map.pl?csq=1000 • Via mapper entry page on obis.org.au (follow link “tools”) credits: Mapper development: Tony Rees, Miroslaw Ryba, Philip Bohm (CMAR) Xplanet (globe rendering): Hari Nair, JPL (via SourceForge)