Download
1 / 8
80 likes | 99 Views
This report provides registration statistics of private security service providers, including geographic spread, number of accredited training centers, and trend analysis. It also highlights changes in the composition of the active workforce.

E N D
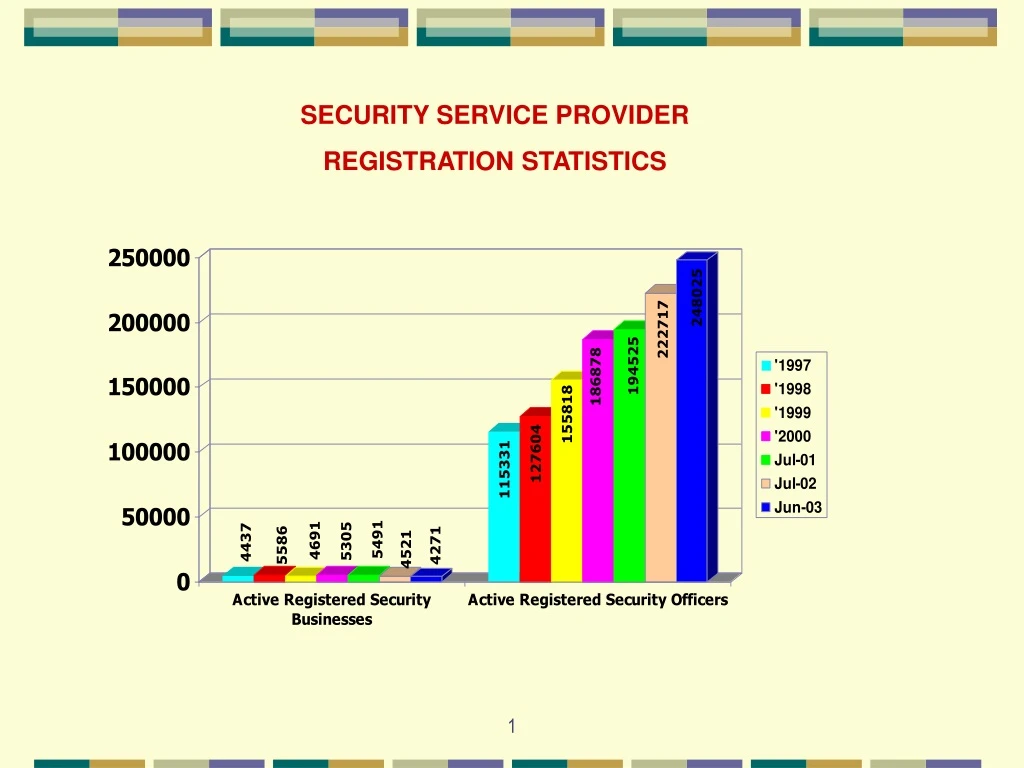
SECURITY SERVICE PROVIDER REGISTRATION STATISTICS 1
PRIVATE SECURITY INDUSTRY REGULATORY AUTHORITY REGISTRATION STATISTICS January 2001 June 2002 June 2003 2
GEOGRAPHIC SPREAD OF ACTIVE REGISTERED SECURITY BUSINESSES 3
GEOGRAPHIC SPREAD OF ACTIVE REGISTERED SECURITY OFFICERS 4
GEOGRAPHIC SPREAD OF ACTIVE REGISTERED ACCREDITED TRAINING CENTRES 5
NUMBER OF ACTIVE REGISTERED ACCREDITED TRAINING CENTRES 6
PRIVATE SECURITY INDUSTRY REGULATORY AUTHORITY ANALYSIS OF SECURITY BUSINESSES – SECURITY OFFICERS EMPLOYED 8
TREND ANALYSIS: 1999/2003 CHANGES IN THE COMPOSITION OF THE ACTIVE WORKFORCE OF INDIVIDUAL SECURITY SERVICE PROVIDERS DECEMBER 1999 JUNE 2003 % CHANGE CRITERIA 145 857 248 025 61.0% increase Number of active security officers Percentage of active security officers not registered with the Authority (54.7%) decrease 9.5% 4.30% Percentage of active security officers with no Authority accredited training (73.2%) decrease 21.6% 5.78% Percentage of active security officers with minimum of grade C training 55.7% increase 29.8% 46.42% Percentage of active security officers with grade A or grade B training 198.0% increase 4.8% 14.32%