Download
1 / 26
350 likes | 811 Views
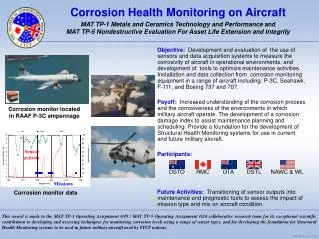
Slide 1. Inhibiting and Monitoring Corrosion. Group 15 Connor Armstrong Abby de Alba Kyle Croft Lamees Elnihum James Johnson. Figure 1. www.undergroundsolutions.com. Slide 2. Problem Overview.

E N D
Slide 1 Inhibiting and Monitoring Corrosion Group 15 Connor Armstrong Abby de Alba Kyle Croft Lamees Elnihum James Johnson Figure 1 • www.undergroundsolutions.com
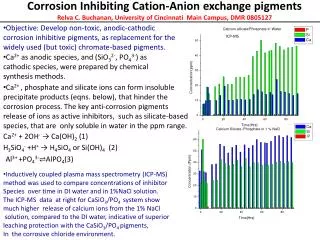
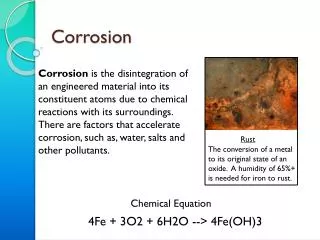
Slide 2 Problem Overview When corrosion is poorly controlled, corrosion products (deposition and microbiological activity) accumulate on heat exchange surfaces and can impede heat transfer, restrict cooling water flow, constrain production, and increase energy consumption. The result can be severe localized corrosion and premature loss of capital equipment. For metallic materials of construction, corrosion control requires an integrated corrosion-management approach, which may include: • Adjusting the cooling water chemistry and/or operating pH • Adding biological disinfectants • Selecting the appropriate corrosion inhibitors. The overall purpose is to understand corrosion and ways to monitor and inhibit it, to • improve cooling water system efficiency • reduce energy consumption • maintain industrial equipment long-term Figure 2: Corrosion of an exposed reinforcing bar. • http://research.che.tamu.edu/groups/Seminario/numerical-topics/Inhibiting%20and%20Monitoring%20Corrosion.pdf • http://www.fhwa.dot.gov/publications/research/infrastructure/structures/04093/03.cfm
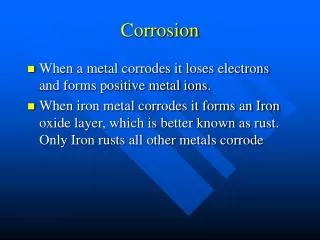
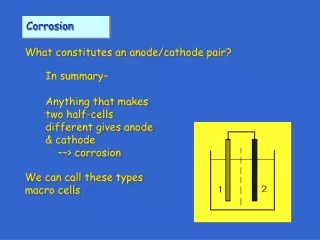
Slide 3 Metallic Corrosion Figure 3 Metallic corrosion is an electrochemical reaction between a metal and its environment. Figure 2 shows an example of how metallic corrosion occurs. Primary corrosion reactions are: • Metal oxidation at the anode • Anodic and cathodic reactions must be simultaneous and at the same rate • Fe Fe2+ + 2e- • Oxygen reduction at the cathode • Corrosion is driven by the cathodic reduction • ½ O2 + H2O + 2e- 2OH- • http://research.che.tamu.edu/groups/Seminario/numerical-topics/Inhibiting%20and%20Monitoring%20Corrosion.pdf • http://2012books.lardbucket.org/books/principles-of-general-chemistry-v1.0/s23-06-corrosion.html
Slide 4 Major Factors of Corrosion Figure 4 • Overall, oxygen is the main driving force for steel corrosion in cooling water • As temperature increases the diffusion of oxygen becomes more rapid, thus at a given oxygen concentration corrosion will increase with increasing temperature Figure 5 • http://hyperphysics.phy-astr.gsu.edu/hbase/chemical/corrosion.html http://www.globalccsinstitute.com/publications/corrosion-and-materials-selection-ccs-systems/online/108256
Slide 5 Corrosion Rate Figure 6 • As shown in Figure 7, corrosion rate increases with increasing water conductivity • Though all ionic species contribute to conductivity, chloride and sulfate anions are the most detrimental • Both anions accelerate corrosion in water Figure 7 • Figure 6shows how chlorides can penetrate protective films and cause pitting corrosion • Pitting is initiated by: • Localized chemical or mechanical damage to the protective oxide film; water chemistry factors which can cause breakdown of a passive film are acidity, low dissolved oxygen concentrations and high concentrations of chloride (as in seawater) • http://www.substech.com/dokuwiki/doku.php?id=pitting_corrosion • http://research.che.tamu.edu/groups/Seminario/numerical-topics/Inhibiting%20and%20Monitoring%20Corrosion.pdf
Slide 6 Acidity and Corrosion Figure 8 • The corrosion rate is also affected by pH • Figure 8shows the relationship between pH and the corrosion rate of iron • In the pH range (pH<4), the iron oxide film is continually dissolved and corrosion is accelerated by the hydrogen reduction reaction: • 2H+ + 2e- H2 • The corrosion rate over the pH range of 4–10 is relatively constant • Above pH 10, the corrosion rate is essentially diminished • Figure 9 shows a corroded iron chain. Figure 9 Figure 10 • http://research.che.tamu.edu/groups/Seminario/numerical-topics/Inhibiting%20and%20Monitoring%20Corrosion.pdf • http://www.cci-icc.gc.ca/caringfor-prendresoindes/articles/metals-metaux/index-eng.aspx
Slide 7 A Numerical Link: Methodology/Formalism -Being able to find an equation that links conductivity to corrosion rate is very important and matlab will allow us to do this and fit the equation to the proper -Matlab will also allow us to use trial and error to find an equation that best fits the curve. -The range at which the data is displayed will also needs to be adjusted in order for the graph to be identical to the given curve -The rate of corrosion is also very important to determine product lifespan, inhibitors to use, and product reliability Figure 11
Slide 8 Matlab Inputs function [f1] = crrr(yee,cond) k1=1; f1=log(yee/k1*cond); end M-File Figure 12: Created by Group 15 >> cond=linspace(0,10); f1=linspace(0,10); yee=2; [f1]=crrr(yee,cond); clf plot(cond,f1); xlim([0 3]) xlim([1 3]) xlim([0.8 3]) set(gca,'XTick',[]) set(gca,'YTick',[]) Command Window Figure 13: Created by Group 15
Slide 9 Matlab Plot Output -Through trial and error a Matlab program successfully outputted a graph that is extremely similar to the given plot of corrosion rate Vs. conductivity Corrosion Rate Conductivity Figure 14: Created by Group 15
Slide 10 Monitoring Methods Corrosion Monitoring is crucial to preventing and controlling the onset of corrosion in the system. It is important to choose methods that suit your process the best. • Metal corrosion coupons • Instantaneous corrosion rate meters • Test heat exchangers Figure 16 Figure 15 • http://www.gewater.com/handbook/cooling_water_systems/fig24-13.jsp • http://events.nace.org/library/corrosion/WaterMain/WaterMain.asp
Slide 11 Corrosion Coupons Figure 17 Simple method for monitoring qualitative and quantitative properties of corrosion. The coupon has unique advantages: • Pit depths indicate pitting severity. • Type/rate of corrosion tied to appearance/weight loss of coupon. However, there are disadvantages: • Lower temperature than heat exchanger tubes. • Corrosion rate is averaged over time. NOTE:the coupon and the system must have the same metallurgy. Water must continuously flow past coupon. Corrosion Coupon Figure 18 Corrosion Coupon Holder • http://www.isa.org/InTechTemplate.cfm?Section=Communities&template=/TaggedPage/DetailDisplay.cfm&ContentID=26843 http://www.cosasco.com/images/products/strip_coupon_holder_6200.jpg
Slide 12 Corrosion Rate Meters Another monitoring method measures the corrosion rate at any instant in time. Linear Polarization Method provides instantaneous data in actual corrosion units. Maximizes reliability, simplicity and performance. Electrical Resistance Method measures electrical resistance increase due to corrosion. Advantages: • Aqueous and nonaqeuous compatible. Disadvantages: • Probe deposits can cause misleading results. • Must account for temperature fluctuation. • Unlike coupons, pitting cannot be determined reliably. Figure 19 • http://www.fhwa.dot.gov/publications/research/infrastructure/structures/04093/03.cfm
Slide 13 Test Heat Exchangers Allow simulation of real corrosion on heat-transfer surfaces. Measure heat-transfer efficiency. Strengths: • Measure heat-transfer efficiency and fouling tendencies. • Flow rate and heat flux can be independently varied. • Measures U as a function of time. Weaknesses: • Limited corrosion information without destroying tubes. Figure 20: Animation • http://www.randsoft.cn/goods.php?id=33 animation link here: http://www.randsoft.cn/images/upload/Image/simerics/semerics7.gif
Slide 14 Controlling Corrosion Corrosion can be inhibited by changing: • Metallurgy • Natural Resistivity • Alloys • Environment • Adjusting water chemistry • Adding corrosion inhibitors Figure 21 Figure 22 • http://research.che.tamu.edu/groups/Seminario/numerical-topics/Inhibiting%20and%20Monitoring%20Corrosion.pdf http://www.thomasnet.com/articles/image/stainless-steel.jpg
Slide 15 Metallurgy Figure 24 • Alloys that are naturally resistant to corrosion, such as stainless steel, can be used. However, often these are too expensive to be practical. • Highly alloyed materials are more prone to localized corrosion. Figure 23 Figure 24shows the corrosion potential of various methods in flowing seawater at ambient temperatures. • http://www.corrosionist.com/stainless_steel_aluminum_galvanic_corrosion.html • http://www.stroudsystems.com/images/pm_fss3.jpg
Slide 16 Natural Resistivity of Metals to Corrosion in Water Figure 25: Created by Group 15 Ratings: 0=Unsuitable, 1=Poor, 2=Fair, 3=Fair to Good, 4=Good, 5=Good to Excellent, 6=Excellent Figure 25displays the natural resistivities of various metals under wet conditions. It can be noted that Stainless Steel has a high resistivity than iron. It is also important to notice that the alloyed steel is less resistant. • http://www.roymech.co.uk/Useful_Tables/Corrosion/Cor_mat.html
Slide 17 Controlling Corrosion Figure 26 Environment The environment can be changed in two ways: • Adjusting water chemistry- oxygen can be added or removed • Vacuum deaeration- removal of oxygen using a vacuum • Impractical for open recirculating cooling systems because oxygen is continually replenished • Oxygen scavengers (more common) react with oxygen to reduce corrosion • Most common: catalyzed sodium sulfite, hydroxylamines, and ascorbic acid • Used in conjunction with an absorption inhibitor to ensure corrosion protection • 2Na2SO3 + O2 2Na2SO4 • http://water.me.vccs.edu/concepts/corrosionchemistry.html
Slide 18 Corrosion Inhibitors Figure 27 • Maximized throughput and increased production • Improved product quality • Improved overall equipment reliability • Reduced equipment cleaning and replacement costs • Lower overall energy cost • Lower waste disposal cost • Improved worker safety and environmental compliance Figure 28 Uninhibited Steel Corrosion Inhibited Steel Corrosion • http://www.gewater.com/products/hydrocarbon-corrosion-inhibitors.html • http://www.verituscorp.com/
Slide 19 Types of Corrosion Inhibitors Figure 29 Anodic Corrosion Inhibitors- These inhibitors are referred to as passivators because they form a protective iron oxide layer on the metal surface rendering it passive to corrosion. ex: Nitrate and Molybate Cathodic Corrosion Inhibitors- The pH at the cathode of the corrosion cell is elevated. Cathodic,or precipitating inhibitors form compounds that are insoluble at this high pH (8.5-12), but whose precipitation can be prevented at the bulk water pH (typically 6.5-9) ex: Zinc, orthophosphate, organic phosphonates, and calcium carbonates Figure 30 Excessive scaling occurs because CaCO3 saturation cannot be adequately controlled by pH adjustment alone Ineffective corrosion inhibitor due to uncontrolled conditions • http://research.che.tamu.edu/groups/Seminario/numerical-topics/Inhibiting%20and%20Monitoring%20Corrosion.pdf • http://www.daubertcromwell.com/howvciworks.asp
Slide 20 Copper Corrosion Inhibitors for Cooling Water Systems • Copper corrosion inhibitors such as aromatic triazoles are the only copper corrosion inhibitor that have been found to be effective for cooling water applications • Excessive chlorination will deactivate benzotriazole and tolytriazole and destroy the protective film on the copper surface Figure 31: Each copper-triazole molecule covers a large surface because the planes of the triazole molecule lie parallel to the metal surface. • In the presence of high chlorine concentrations absorption inhibitors are more efficient • These are materials that absorb on the metal surface and provide a physical barrier between the surface and the water Figure 32: The aromatic triazoles are the only copper corrosion inhibitors effective for cooling water applications. • http://research.che.tamu.edu/groups/Seminario/numerical-topics/Inhibiting%20and%20Monitoring%20Corrosion.pdf
Slide 21 A Numerical Link to Corrosion It would be helpful to find equations that fit the curves that link corrosion rate vs. oxygen concentration at different temperatures Using Matlab, a code can be written to find equations that fit the data using trial and error with quadratic interpolation • It is important to be able to extend the curves, which will allow us to have more data and we will be able to determine the corrosion rates at more Oxygen concentrations • Other temperature curves could also be estimated using this matlab in matlab Figure 33 For a given oxygen concentration, corrosion rates increase with increasing temperature due to more rapid oxygen diffusion. • http://research.che.tamu.edu/groups/Seminario/numerical-topics/Inhibiting%20and%20Monitoring%20Corrosion.pdf
Slide 22 Matlab Input Files Figure 34: Created by Group 15 %m-file name and defining variables function [f1,f2,f3] = crr(temp1, temp2, temp3, o2) %Initial guesses for coefficients k1=1412; k2=2*1412; k3=3*1412; %equation for curve f1=temp1/k1*o2.^2+1.5; f2=temp2/k2*o2.^2+1.5; f3=temp3/k3*o2.^2+1.5; %program end end m-file: This file contains the equations that fit the curves, which will be run in the command window. This m-file is used in the command window to output a graph and trial and error is used to estimate the curves closely %setting the x-axis of the plot o2=linspace(0,10); %setting the temperature variables with the temperatures of the curve temp1=120; temp2=90; temp3=48; %bringing in the m-file function [f1,f2,f3]=crr(temp1,temp2,temp3,o2); >> clf %plotting each graph with a hold on command to plot multiple curves >> plot(o2,f1); >> hold on >> plot(o2,f2); >> plot(o2,f3); Command window:The x-axis is set with the linspace function, which goes from 0 to 10. All of the temperatures are set, which are the same from figure 5 from the corrosion article. Each function is plotted and the plot is presented on the next slide. Figure 35: Created by Group 15
Slide 23 Matlab Corrosion Rate vs. Oxygen Concentration Plot Corrosion Rate Oxygen Concentration Figure 36: Created by Group 15
Slide 24 Conclusions & Suggested Future Work • We can set up an effective corrosion-management system that contributes to cooling water system reliability as long as we • understand the factors that affect corrosion • understand ways we can inhibit corrosion • and understand ways we can monitor corrosion. Figure 38: Photograph of hinged arches and piling Figure 37 • http://research.che.tamu.edu/groups/Seminario/numerical-topics/Inhibiting%20and%20Monitoring%20Corrosion.pdf • http://www.fhwa.dot.gov/publications/research/infrastructure/structures/04093/03.cfm
Slide 25 Future Work • For future work, we suggest that: • Equations be found and plots made for corrosion rate versus oxygen concentration, since oxygen is the main dirving force for steel corrosion in cooling water, as well as for iron. • Test heat exchangers be designed to deliver corrosion information without visual observation (integrate a transducer that will numerically translate and send info digitally to another electronic device). Figure 39 Figure 41 Figure 40 http://www.seagrant.umn.edu/newsletter/2008/05/images/steelcorrosion.jpg http://www.davisexporters.com/wp-content/uploads/2013/05/Heat_exchanger.jpg
Slide 26 References • Geiger, G., & Esmacher, M. (2012). Inhibiting and monitoring corrosion. CEP, Retrieved from http://www.aiche.org/resources/publications/cep • Chapra, S. (2011). Applied numerical methods with matlab. (3rd ed.). New York: McGraw-Hill. • Callister, S. (2012).Fundamentals of Materials Science and Engineering: An Integrated Approach (4th ed.). Wiley. • Singer, M., Z. Zhang, H. Wang, S. Nes˘ic, and D. Hinkson. "CO2 Top-of-the-Line Corrosion in Presence of Acetic Acid: A Parametric Study." (n.d.): n. pag. Web. Retrieved from http://www.corrosionjournal.org/doi/pdf/10.5006/0737 Figure 42