Using Data for On-going Problem Solving
This resource provides a comprehensive approach to using data for ongoing problem-solving in schools. It emphasizes the importance of analyzing office referrals, attendance rates, faculty reports, and additional climate data to identify problematic systems and individuals. By interpreting trends, understanding common problem behaviors, and recognizing peak times for issues, educators can determine whether there is a genuine problem. The document encourages maintaining, modifying, or terminating initiatives based on findings and highlights the need to combine multiple data sources for a holistic perspective on school climate and performance.

Using Data for On-going Problem Solving
E N D
Presentation Transcript
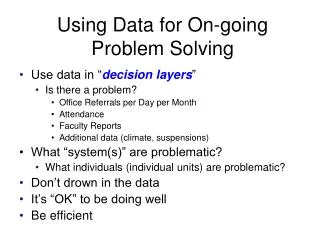
Using Data for On-going Problem Solving • Use data in “decision layers” • Is there a problem? • Office Referrals per Day per Month • Attendance • Faculty Reports • Additional data (climate, suspensions) • What “system(s)” are problematic? • What individuals (individual units) are problematic? • Don’t drown in the data • It’s “OK” to be doing well • Be efficient
Interpreting Office Referral Data:Is there a problem? • Absolute level (depending on size of school) • Middle Schools (>10) • Elementary Schools (>3) • Trends • Peaks before breaks? • Gradual increasing trend across year? • Compare levels to last year • Improvement?
What Systems are Problematic? • Referrals by problem behavior? • What problem behaviors are most common? • Referrals by location? • Are there specific problem locations? • Referrals by student? • Are there many students receiving referrals or only a small number of students with many referrals? • Referrals by time of day? • Are there specific times when problems occur?
Combining Information • Guiding questions • Is there a problem? • What data did you use? • What systems are problematic? • Where do you need to focus? • The next level of information needed • What information is NOT needed? • How to identify problem individuals and areas • Individual student data • Direct observation • Faculty/Staff report • Designing solutions • If many students are making the same mistake, it typically is the system that needs to change, not the students. • Teach, monitor and reward before relying on punishment.
Other Available Data Sources • Annual School Climate Survey • Safety, weapons, fighting • Student, teacher & parent responses • Suspensions • Disproportionality • Attendance • Academic performance • PBIS Implementation fidelity • School-wide Evaluation Tool (SET); Team Implementation Checklist; Implementation Phases Inventory (IPI); Staff Survey • What else?