Download
1 / 40
400 likes | 427 Views
This study examines the current transportation funding formula in North Carolina to assess its effectiveness in promoting efficiency and equity across urban and rural school districts. The report provides recommendations for improving the formula to ensure fair and cost-effective allocation of resources. By evaluating the formula's impact and gathering input from local education agencies, the study aims to enhance the overall transportation funding process in the state.

E N D
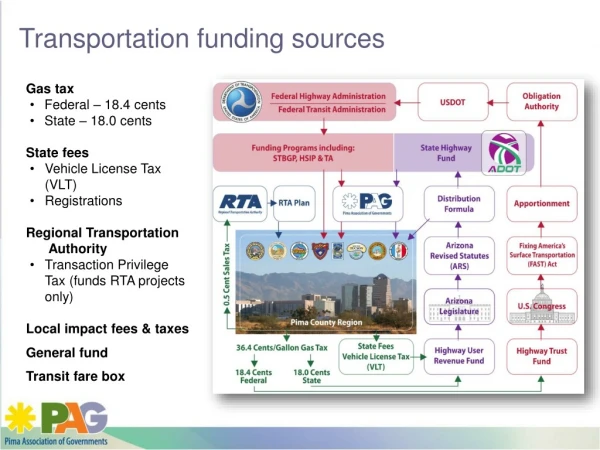
Transportation Funding Formula Study Derek Graham, Section Chief DPI Transportation Services
Background:Current Funding Formula Origin • 1989 Legislative Session “…the Department shall report its final recommendations for achieving improved efficiency and economy in pupil transportation operations to the 1990 Session of the General Assembly. These recommendations shall include incentives for encouraging cost-effective operations in local school administrative units as provided in the General Statutes.”
Block Grant Allotments:Eliminated Line Item Allotments Fuel Salaries Tires/Repair Parts Flexibility to Use Funds where needed Block Grant based on a Budget Rating Expenditures Students Transported Buses Operated Budget Rating is an indication of Efficiency Transportation FundingLocal ControlAccountability 1990 - 1992
Budget Rating Simulator Tools Provided Transportation Information Management System (TIMS) 1990 - 1992
Problem: The formula was not fully funded Even those counties with 100% ratings were shorted because DPI did not have enough funds to allot what the formula required 1992 - 1995
General Assembly Actions 1995 • Review of Transportation Funding • Study of Caswell, Chatham and Cumberland Counties • Reports/Recommendations given to counties • Regional Discussion Sessions for Superintendents, Finance Officers, Transportation Directors • What Works? / What Doesn’t? 1995
* * * * * Regional Discussion Sessions • RESULTS: • Formula Does Promote Efficiency • Flexibility is Good • Overall Funding is a major problem • E.C. Contract Transp. Costs Beyond Control • Modifications to formula math to improve equity 1996
2005 General Assembly Action * DPI shall contract for a study of the current allotment formula for school transportation. The study shall be conducted by an independent consultant. The consultant shall consider whether: • the current formula sufficiently encourages the efficient and effective use of school transportation funds by urban and rural school systems, • the formula is adequately and equitably meeting the needs of school systems, and • the formula is appropriate in light of the Leandro litigation. The consultant shall also propose options for reducing the severe and growing disparity in funding that exists under the formula among local school administrative units. 2005
Contract for Study of the Transportation Formula Management Partnership Services (MD) TransTech Management (NC) Project team included: • Staff with transportation fleet/funding expertise, but not with the NC model • Staff familiar with the development and mathematics of the existing formula • Staff dedicated to gathering LEA input
Recommendations This report provided by Management Partnership Services includes recommendations for the State Board of Education to forward to the General Assembly
North Carolina Department of Public Instruction Funding Formula Recommendations Management Partnership Services, Inc May 2006
Project Objectives • Meet with & allow administrators from all LEAs to provide feedback on formula • Identify key issues expressed by LEAs • Evaluate formula effectiveness in creating efficient transportation in NC • Recommend equitable funding process that retains efficiency incentives
Project Methodology • Survey LEAs • LEA interviews/ meetings • Test site characteristics • Sensitivity analyses • Trend analyses • Simulation scenarios
LEA Input: The current formula … • Is not equitable – favors larger LEAs • Provides inadequate overall State funding • Permits base year & local funding to perpetuate advantage to “have” LEAs • Limits options to improve for Small LEAs • Inadequately adjusts for (their) key site characteristics • Doesn’t guide LEAs on how to improve Other comments: • Change, but don’t replace the formula • Funding objectives & general operation understood
Step 1: Improve Formula Effectiveness • Retain the basic funding mechanism • Emphasize good service & safety outside of formula • Upgrade statistical and data recovery tools
A. Retain Funding Mechanism Current formula operationally sound • Allocation process influences behavior: • Resulted in improved efficiency • No evidence of bias • Provided for an effective statewide student transportation system • A complex problem requires a complex solution
…Leading to A Reduction of 675 Buses Efficiency incentives resulted in North Carolina operating 675 fewer buses for the past 14 years.
Change in Costs (Uncapped) Average Increase: 5.5% (vs. inflation 2.8%)
SERVICE COST B. Emphasize Good Service & Safety Publish performance results by LEA • Ride time distribution • Earliest pickup, latest (PM) drop-off • Bus accidents per thousand miles • Traffic citations per driver • Annual fatalities/ injuries • Service & safety should not be traded down for cost
Factoring Service and Safety Compare performance on equitable basis • Collect service indicator data from each LEA. • Adjust service indicators for site characteristics • Compute expected level of performance for each LEA. • Compare with actual level of performance. • Test for statistical significance of differences
C. Upgrade Administrative Tools Better support for DPI management • Utilize commercial software for statistical and frontier computations • Upgrade simulator • Facilitates better, faster analyses • Improved reporting capability • Improved audit capability
Step 2: Improve Formula Equity • Modify calculation; “Frontier Model” • Standardize site characteristics to improve clarity for LEAs • Reduce budget rating buffer and continue to limit the eligibility of certain local $$ • Treat busing for non-traditional programs consistently with State education priorities
Modify Calculation “Frontier Model” Eliminates “Alley Anomaly” • Current model: LEAs can increase local $$ without a resulting funding reduction • FrontierModel limits maximum funding relative to most efficient LEAs • Method adjusts costs and buses; helps LEAs to determine cost and number of buses needed to be efficient
Alley Illustration: “Removing the Slack” Most (bus) efficient LEA sets $$ maximum Frontier Model limits highest cost per student = most bus efficient LEA (“T”)
B. Standardize Site Characteristics Recurring factors simplify calculation • Student density largest impact • Circuity & distance to school next • Not necessary to re-run variables each year • Predictable site characteristics improve clarity for LEAs • Frontier formula site characteristics identify 94 – 95% of influence on resource (inputs)
C. Reduce Budget Rating Buffer & Limit Local $$ Infusion Decide on Local $$ Inclusion • Problem: Efficient LEA using local $$ can get an infinite stream of additional State funding • Continue to limit eligibility of certain local $$ • Some buffer needs to be preserved • Reducing 10% buffer to 5-6% and maintaining some local $$ cap will mitigate the issue • MPS continuing evaluation
Simulation : Impact of Local $$ and Buffers High wealth LEA, making $3M annual local contribution. Buffers 0% – 10% Low wealth LEA, making no annual local contribution
SITE CHARACT. RESOURCE DEMAND PROGRAM NEEDS COST CONSTRAINTS D. Non-Traditional Programs Political, not a logistical decision • Include programs if State wants to fund • Federal, local mandates; Leandro • Educational priorities of State • Keep as is if to remain a local choice • Formula treats LEA programs appropriately if funded locally • Presents some equity issues (Rich v. Poor) • NCLB funded separately
A: Include in Funding Implications of Decision • Decision should conform to other areas of educational funding • Specific programs funded is a management choice
A: Include in Funding, cont’d. • Programs to be funded should be factored into funding model; or • Fund outside of formula during transition period • Develop site characteristics during transition • Integrate in formula once data history developed • Program start up may require State $$ infusion • Low-wealth districts may need $ infusion • Wealthy LEAs: Factor treatment of infused local $$ • Do not penalize LEAs choosing only traditional programs
B: Retain As Is Implications of Decision • State pays only for basic transportation • Current formula with recommended changes treats costs appropriately • Decision implies programs funded locally • Further analysis: Adjust influence of existing non-basic transportation for site characteristics
Summary • Modify calculation: Basic formula design has achieved desired result re: efficiency. Site characteristics can be standardized. • Resolve local funding issue: Unintended increased result from infusion of local $$ by LEAs and the rating buffer • Consider service factors: Effort to increase rating may be resulting in service being traded for efficiency • Decide on treatment of non-traditional programs: Decision based on educational priorities and political considerations • Upgrade administrative tools: Newer statistical applications will simplify calculation process and funding administration.
Transportation Funding Formula Study Derek Graham, Section Chief DPI Transportation Services