Download
1 / 36
370 likes | 605 Views
10. Economic Growth, the Financial System, and Business Cycles. CHAPTER. Chapter Outline and Learning Objectives. Obtaining economic growth. We all want the United States to have a “strong” economy, since this will hopefully result in a better life for us and the people we care about.

E N D
10 Economic Growth, the Financial System, and Business Cycles CHAPTER Chapter Outline and Learning Objectives
Obtaining economic growth We all want the United States to have a “strong” economy, since this will hopefully result in a better life for us and the people we care about. What does it mean for the economy to be “strong” vs. “weak”? In this chapter, we will explore what the concepts mean in the long-term, and also in the short-term. We will also explore what sorts of things seem to lead to a stronger vs. weaker economy.
Long-Run Economic Growth 10.1 LEARNING OBJECTIVE Discuss the importance of long-run economic growth.
Long-run economic growth When we speak of long-run economic growth, we mean the process by which rising productivity increases the average standard of living. The most commonly used measure of this average standard of living is real GDP per capita: the amount of production in the economy, per person, adjusted for changes in the price level. Figure 10.1 As the chart shows, real GDP per capita has risen nearly eight-fold since 1900; the average American can buy eight times as many goods and services now as in 1900.
Calculating growth rates The growth rate of an economic variable like real GDP or real GDP per capita is equal to the percentage change from one year to the next. Over periods of a few years, we can average the growth rates to find the approximate annual rate of growth.
Growth rates over longer periods For longer time periods, we wouldn’t want to calculate each of the annual growth rates and then take an average in order to find the average annual growth rate; instead we would solve for the growth rate g, where: Previous real GDP x (1+g)t = Current real GDP with t the number of time periods between the previous and current periods. A useful shortcut called the Rule of 70 can help us to determine how long it will take for an economic variable to double: So if the growth rate is 5%, it will take about 14 years for the variable to double.
What determines the rate of long-run growth? Increases in real GDP per capita rely on increases in labor productivity: the quantity of goods and services that can be produced by one worker or by one hour of work. Why can the average American consume eight times as many goods and services now, as in 1900? Because the average American produces eight times as many goods and services in an hour now, as in 1900. So most of the answer to “what determines the rate of long-run growth” is the same as the answer to “what determines labor productivity growth?”
Factors affecting labor productivity growth Increases in capital per hour worked Capital is manufactured goods that are used to produce other goods and services. The more capital a worker has available to use (including human capital, the accumulated knowledge and skills workers possess), the more productive he or she will be. Technological change Improvements in capital or methods to combine inputs into outputs (i.e. newtechnologies) allow workers to produce more in a given period of time. The role of entrepreneurs here is critical, in pioneering new ways to bring together the factors of production to produce better or lower-cost products.
Potential GDP Potential GDP refers to the level of real GDP attained when all firms are operating at capacity. Capacity here refers to “normal” hours and a “normal” sized workforce. Potential GDP rises when the labor force expands, when a nation acquires more capital stock, or when new technologies are created. The growth in potential GDP in the U.S. has been relatively steady at about 3.3%; that is, the potential to produce final goods and services has been growing in the U.S. at about this rate over time. The recession of 2007-2009 resulted in a wider than usual gap between potential and actual GDP, as the next slide illustrates.
Actual and potential GDP in the United States Figure 10.2
Saving, Investment, and the Financial System 10.2 LEARNING OBJECTIVE Discuss the role of the financial system in facilitating long-run economic growth.
The financial system Firms can finance some of their own expansion through retained earnings, reinvesting profits back into the firm. But often firms want to obtain more funds for expansion than are available in this way. They obtain these funds via the financial system: the system of financial markets and financial intermediaries through which firms acquire funds from households. Example: stock and bond markets Example: banks
Financial markets Financial marketsare markets where financial securities, such as stocks and bonds, are bought and sold. A financial security is a document (sometimes electronic) stating the terms under which funds pass from the buyer of the security to the seller. A stock is a financial security representing partial ownership of a firm. A bond is a financial security promising to repay a fixed amount of funds. A bond essentially a loan from a household to a firm.
Financial intermediaries Financial intermediaries are firms, such as banks, mutual funds, pension funds, and insurance companies, that borrow funds from savers and lend them to borrowers. Some financial intermediaries, like mutual funds, sell shares to savers then use the funds to buy financial securities.
Three key services of the financial system The financial system provides three key services: Risk-sharing By allowing investors to spread their money over many different assets, investors can reduce their risk while maintaining a high expected return on their investment Liquidity The financial system allows savers to quickly convert their investments into cash. Information The prices of financial securities represent the beliefs of other investors and financial intermediaries about the future revenue stream from holding those securities. This aggregation of information makes funds flow to the right firms.
The macroeconomics of savings and investment We will now derive the result that the total value of saving in the economy must equal the total value of investment. Recall that we can express the GDP of a nation (Y) as the sum of consumption (C), investment (I), government purchases (G), and net exports (NX). That is, Y = C + I + G + NX For the sake of simplicity, we will assume a closed economy, with no exports or imports; so Y = C + I + G We can rearrange this to obtain an expression for investment: I = Y – C – G That is, investment in a closed economy is equal to income minus consumption and government purchases.
The macroeconomics of savings and investment Now let’s examine savings. Savings is composed of private savings (by households, SPrivate) and public savings (by the government, SPublic). SPrivate is equal to all household income that is not spent; household incomes derive from the payments for factors of production (Y) and transfer payments (TR); households spend money on consumption (C) and taxes (T). So SPrivate = Y + TR – C – T The government “saves” whatever it brings in but does not spend (this may be negative, known as dissaving): SPublic = T – G – TR So total saving is: S = SPrivate+SPublic = Y + TR – C – T + T – G – TR = Y – C – G
Savings equals investment The two previous slides led us to the same expressions for savings and investment. So we conclude that savings must equal investment: S = I When SPublic is zero, the government spends as much as it brings in; this is known as a balanced budget. Negative and positive values for SPublic are known as budget deficits and budget surpluses respectively. Since the federal government funds its current deficits with borrowing (selling Treasury bonds), this takes away from the money available for investment spending.
The market for loanable funds If savings must equal investments, how exactly does this occur? The financial system is composed of many different markets—the market for stocks, for bonds, for certificates of deposits at banks, etc. A convenient way to model these is as a single market: the market for loanable funds, which is a conceptual interaction of borrowers and lenders determining the market interest rate and the quantity of loanable funds exchanged. For now, we will assume that interactions are only between domestic households and firms—there is no interaction from foreign lenders and borrowers.
The market for loanable funds Firms borrow loanable funds from households. They borrow more when households demand a lower return on their money—a lower real interest rate. Households supply loanable funds to firms. They provide more when firms offer them a greater reward for delaying consumption—a higher real interest rate. Governments, through their saving or dissaving, affect the quantity of funds that “pass through” to firms. Figure 10.3 The equilibrium real interest rate and quantity of loanable funds is determined by this supply and demand.
An increase in the demand for loanable funds Figure 10.4 Suppose that technological change occurs, so that investments become more profitable for firms. This will increase the demand for loanable funds. The real interest rate will rise, as will the quantity of funds loaned.
“Crowding out” in the market for loanable funds Figure 10.5 Suppose the government runs a budget deficit. To fund the deficit, it sells bonds to households, decreasing the supply of funds available to firms. This raises the equilibrium real interest rate, and decreases the funds loaned to firms. This is referred to as crowding out: the decline in investment spending that occurs as a result of increases in government purchases.
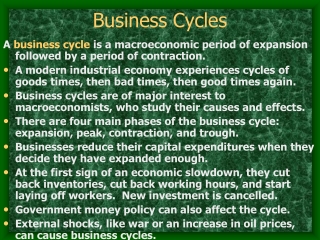
The Business Cycle 10.3 LEARNING OBJECTIVE Explain what happens during the business cycle.
The business cycle While real GDP per capita has risen about eight-fold since the start of the 20th century, it has not risen consistently every year. Since at least the early 19th century, the American economy has experienced alternating periods of expanding and contracting economic activity. Figure 10.6a The figure shows a typical idealized path for real GDP—rising, falling, then rising again. The phases of rising are known as expansion; the periods of falling are recessions. We refer to the points at which the economy changes from one phase to the other as peaks or troughs, respectively.
The business cycle, 2005-2011 Figure 10.6b This figure shows the movements in real GDP in the U.S. from 2005 to 2011 The period of recession starting in late 2007 and ending in mid 2009 was the longest and most severe since the Great Depression of the 1930s, prompting some to refer to it as the Great Recession. Real GDP growth after this recession has been slower than is typical at the start of a business cycle expansion.
How do we known when the economy is in a recession? The federal government does not define when a recession starts or ends. The typical media definition of a recession is “two consecutive quarters of declining real GDP. Table 10.1 NBER-defined recessions since 1950 However most economists defer to the judgment of the National Bureau of Economic Research: “A recession is a significant decline in activity spread across the economy, lasting more than a few months, visible in industrial production, employment, real income, and wholesale-retail trade.”
Effects of business cycles on firms When a recession hits, workers reduce spending due to expectations about their current and future incomes decreasing. But this reduction in spending doesn’t affect all goods equally. Consumers mostly continue to buy nondurables like food and clothing. But purchases of durable goods, ones that (by definition) are expected to last three or more years, are more strongly affected. This includes goods like furniture, appliances, and automobiles—goods that consumers can continue to use for a little longer when their purchasing power decreases. Hence firms selling durable goods are more likely to be hit hard by a recession.
The effect of the business cycle on Boeing Boeing makes aircraft—very much a durable good. So we expect their sales to be strongly affected by recessions. Figure 10.7 The charts show this prediction to be accurate—though Boeing was less affected by the recession of 2007-2009 than we might have expected; overseas demand remained strong in this period.
The effect of the business cycle on inflation The inflation rate measures the change in the price level from one year to the next. During expansions, demand for products is high relative to supply, resulting in prices increasing—high inflation. During recessions, demand for products is low relative to supply, resulting in prices increasing more slowly or even decreasing—low inflation or deflation. The graph on the next slide shows the movements in the (CPI) inflation rate over the last two decades.
The effect of the business cycle on inflation—graph Figure 10.8 (red bars indicate recession) Notice that inflation tends to rise toward the end of an expansion, and fall over the course of each recession.
The effect of the business cycle on unemployment As firms see their sales start to fall in a recession, they generally reduce production and lay off workers. Figure 10.9 (red bars indicate recession) Notice that unemployment often continues to rise, even after the end of each recession.
Fluctuations in real GDP: 1900-2010 Figure 10.10 Annual fluctuations in real GDP were typically greater before 1950 than after 1950. Economists refer to this as the “Great Moderation”.
Is the Great Moderation over? The length and severity of the recession of 2007-2009 has made some economists and policymakers wonder if we would return to the post-1950 pattern of long expansions and short, mild recessions. Table 10.2 • Note: The World War I and World War II periods have been omitted from the computations in the table. • The expansion that began in June 2009 is not included. To judge whether this Great Moderation is over, it is useful to consider why has occurred at all, and consider what if anything has fundamentally changed.
Explaining the Great Moderation Several factors help to explain the Great Moderation: The increasing importance of services Manufacturing (especially of durable goods) is more strongly affected by recessions. The economy is based more on services now, decreasing the effect of the business cycle on GDP. The establishment of unemployment insurance Before the 1930s, unemployment insurance and other government transfer programs like Social Security did not exist. These programs increase the ability of consumers to purchase goods and services during recessions. Active federal government stabilization policies Increased stability of the financial system
Explaining the Great Moderation Several factors help to explain the Great Moderation: The increasing importance of services The establishment of unemployment insurance Active federal government stabilization policies Many, though not all, economists believe that active government policies to lengthen expansions and minimize the effects of recessions have had the desired effect. The debate over the role of government in this way became particularly intense during the recession of 2007-2009. Increased stability of the financial system The severity of the Great Depression of the 1930s was in part caused by instability in the financial system; similar instability exacerbated the recession of 2007-2009. Returning to macroeconomic stability will require a stable financial system.
Common misconceptions to avoid Economists often have different terms to describe a variable and changes in that variable: Real GDP vs. economic growth rate Price level vs. inflation “Savings” is composed of both private and public savings; it is easy to forget about the latter. A “trough” is the end of a recession—the lowest point GDP obtains before beginning to rise again. Don’t confuse “trough” and “recession”. Recessions do not affect all firms equally.