Download
1 / 8
261 likes | 513 Views
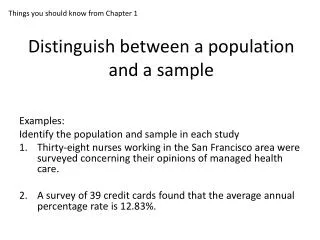
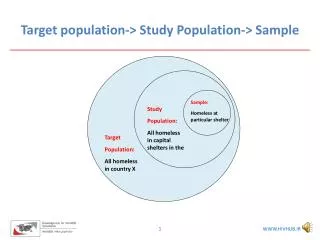
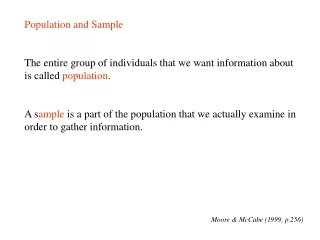
Population and Sample The entire group of individuals that we want information about is called population . A s ample is a part of the population that we actually examine in order to gather information. Moore & McCabe (1999, p.256). Parameters and Statistics

E N D
Population and Sample The entire group of individuals that we want information about is called population. A sample is a part of the population that we actually examine in order to gather information. Moore & McCabe (1999, p.256)
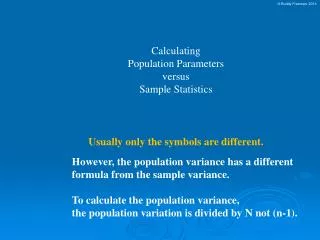
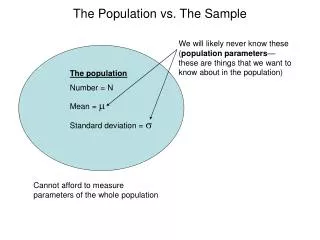
Parameters and Statistics A parameter is a number that describes the population. A parameter is a fixed number, but in practice we do not know its value. A statistic is a number that describes a sample. The value of a statistic is known when we have taken a sample, but it can change from sample to sample. We often use a statistic to estimate an unknown parameter. Moore & McCabe (1999, p.268)
Population Sample Statistic: Proportion Count Mean Median Parameter: Proportion p Count Mean Median
Sampling Distribution The sampling distribution of a statistic is the distribution of values taken by the statistic in all possible samples of the same size from the same population. Moore & McCabe (1999, p.269) Sampling Distribution of Proportions Sampling Distribution of Means
p Sample Proportion = p Population
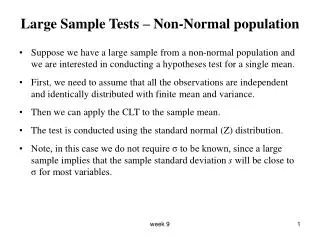
Central Limit Theorem for a Sample Proportion Suppose that a simple random sample of size n is taken from a large population in which the true proportion possessing the attribute of interest is p. Then the sampling distribution of the sample proportion is approximately normal with mean p and standard deviation . This approximation becomes more and more accurate as the sample size n increases, and it is generally considered to be valid, provided that . Rossman et al. (2001, p.375)
Sample Mean = Population
Central Limit Theorem for a Sample Mean Suppose that a simple random sample of size n is taken from a large population in which the variable of interest has mean and standard deviation . Then, provided that n is large (at least 30 as a rule of thumb), the sampling distribution of the sample mean is approximately normal with mean and standard deviation . The approximation holds with large sample sizes regardless of the shape of the population distribution. The accuracy of the approximation increases as the sample size increases. For populations that are themselves normally distributed, the result holds not approximately but exactly. Rossman et al. (2001, p.398)