Download
1 / 25
270 likes | 423 Views
Inferring Sample Findings to the Population and Testing for Differences. Statistics versus Parameters. Values computed from samples are statistics! Values computed from the population are parameters! Use Greek letters when referring to parameters. Use Roman letters for statistics.

E N D
Inferring Sample Findings to the Population and Testing for Differences
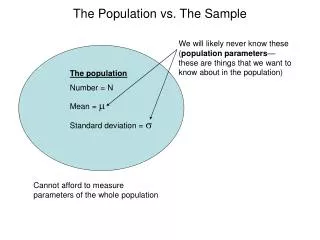
Statistics versus Parameters • Values computed from samples are statistics! • Values computed from the population are parameters! • Use Greek letters when referring to parameters. • Use Roman letters for statistics.
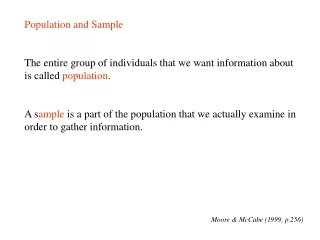
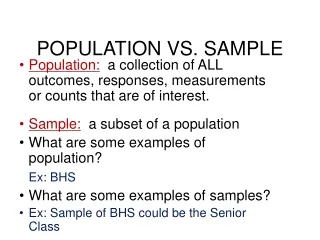
Inference and Statistical Inference • Inference - generalize about an entire class based on what you have observed about a small set of members of that class. • Draw a conclusion from a small amount of evidence. • Statistical Inference - Sample size and sample statistics are used to make estimates of population parameters.
Statistical procedure used to accept or reject the hypothesis based on sample information. Steps in hypothesis testing Begin with a statement about what you believe exists in the population. Draw a random sample and determine the sample statistic. Compare the statistic with the hypothesized parameter. Decide whether or not the sample supports the original hypothesis If the sample does not support the hypothesis, revise the hypothesis to be consistent with the sample's statistic. Hypothesis Testing
Test of the Hypothesized Population Parameter Value For example, we hypothesize that the average GPA for business majors is not the same as Recreation majors. The sample mean is compared to the hypothesized mean, if z exceeds critical value of z (e.g., 1.96) then we reject the hypothesis that the population mean is Mu.
Directional Hypotheses • Indicates the direction in which you believe the population parameter falls. • For example, the average GPA of business majors is higher than the average GPA of Recreation Majors. • Note that we are now interested in the volume of the curve on only one side of the mean.
Interpretation • If the hypothesis about the population parameter is correct or true,then a high percentage of the sample means must fall close to this value (i.e., within +/-1.96 sd.) • Failure to support the hypothesis tells the hypothesizer that the assumptions about the population are in error.
Testing for Differences Between Two Means • Ho: There is no difference between two means. (Mu1=Mu2) • Ha: There is a difference between two means. (Mu1does not equal Mu2).
Testing for Differences Between Two Means: Example • Is there a statistically significant difference between men and women on how many movies they have seen in the last month? • Ho: There is no difference between two means. (MuW=MuM) • Ha: There is a difference between two means. (MuW/=MuM)
Example Gender N Mean St. Dev male 19 2.3684 1.98 female 13 2.5385 2.18 t df Significance (2 tailed) TOTAL -.229 30 .820 F Sig. Levene’s test for equality of variance .004 .952
Testing for Differences Between Two Means • Fail to reject the null hypothesis, that the means are equal • Why? • Significance = .82 • Reject any significance lower than .05 • .82 > ,05; therefore, fail to reject null • there is no statistically significant difference between men and women on how many movies seen in last month • makes sense - look at means (2.36 & 2.53)
Small Sample Size - t-Test • Normal bell curve assumptions are invalid when sample sizes are 30 or less. • Alternative choice is t-Test • Shape of t distribution is determined by sample size (i.e., degrees of freedom). • df = n-1
ANOVA • ANOVA = Analysis of Variance • Compares means across multiple groups • ANOVA will tell you that one pair of means has a statistically significant difference but not which one • Assumptions: • independence • normality • equality of variance (Levene test)
Analysis of Variance When researchers want to compare the means of three or more groups. ANOVA used to facilitate comparison! Basic Analysis Does a statistical significance difference exist between at least two groups of means? ANOVA does not communicate how many pairs of means are statistically significant in their differences.
Hypothesis Testing Ho: There is no difference among the population means for the various groups. Ha: At least two groups have different population means.. When MSBetween is significantly greater than MSWithin then we reject Ho.
F value F = MSBetween/MSWithin If F exceeds Critical F(df1, df2) then we reject Ho.
Visual Representation Population 2 Population 1 Population 3 Population 4 Population 5 Appears that at least 2 populations have different means.
Visual Representation Population 3 Population 2 Population 1 Population 4 Population 5 Appears that populations do not have significantly different means.
Tests of Differences • Chi-square goodness-of-fit • Does some observed pattern of frequencies correspond to an expected pattern? • Z-test/T-test • Is there a significant difference between the means of two groups? • ANOVA • Is there a significant difference between the means of more than two groups?
When to Use each Test • Chi-square goodness-of-fit • Both variables are categorical/nominal. • T-test • One variable is continuous; the other is categorical with two groups/categories. • ANOVA • One variable is continuous (i.e., interval or ratio); the other is categorical with more than two groups.
How to Interpret a Significantp-value (p < .05) • Chi-square goodness-of-fit • “There is a significant difference in frequency of responses among the different groups (or categories).” • T-test • “The means (averages) of the 2 population groups are different on the characteristic being tested.” • ANOVA • “The means of the (multiple) population groups are different - need post hoc test (e.g., Bonferroni) to determine exactly which group means are different from one another.”
Measuring Association • Is there any association (correlation) between two or more variables? • If so, what is the strength and direction of the correlation? • Can we predict one variable (dependent variable) based on its association with other variables (independent variables)?
Correlation Analysis • estimate of correlation between two A statistical technique used to measure the closeness of the linear relationship between two or more variables. • Can offer evidence of causality, but is not enough to establish causality by itself (must also have evidence of knowledge/theory and correct sequence of variables). • Scatterplots can give visualvariables.
Regression Analysis • Simple Regression • relate a single criterion (dependent) variable to a single predictor (independent) variable • Multiple Regression • relate a single criterion variable to multiple predictor variables • All variables should be at least interval!
Correlation/Regression • Coefficient of Correlation (r) • measure of the strength of linear association between two variables • also called “Pearson’s r” or “product-moment” • ranges from -1 to +1 • Coefficient of Determination (r2) • proportion of variance in the criterion explained by the fitted regression equation (of predictors)