Download
1 / 35
350 likes | 375 Views
Understand decision analysis methods for rational decision-making in uncertain outcomes using maximin, likelihood, and Bayes’ decision rules. Evaluate risks, payoffs, and probabilities for making informed decisions. Learn how sensitivity analysis and experimentation can enhance decision-making processes.

E N D
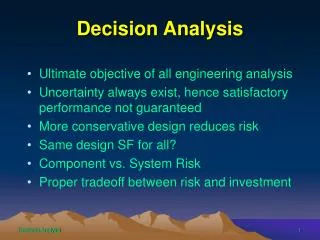
Decision Analysis provides a framework and methodology for rational decision making when the outcomes are uncertain.
Example Status of Land Payoff Alternative Oil Dry Drill for oil -$100,000 $ 90,000 3 in 4 $700,000 $ 90,000 1 in 4 Sell the land Chance of status The cost of drilling : $100,000 If oil is found, the expected revenue : $800,000 A selling price of the land : $ 90,000
Maximin payoff criterion Maximum likelihood criterion Bayes’ Decision Rule
Maximin payoff criterion: For each possible action, find the minimum payoff over all possible states of nature. Next, find the maximum of these minimum payoffs. Choose the action whose minimum payoff gives this maximum.
Maximin payoff criterion State of Nature Minimum in Row Alternative Oil Dry Drill -100 90 -100 90 700 90 Maximin Sell
Maximum likelihood criterion: Identify the most likely state of nature (the one with the largest prior probability). For this state of nature, find the action with the maximum payoff. Choose this action.
Maximum likelihood criterion State of Nature Alternative Oil Dry Drill -100 90 0.75 700 90 0.25 Maximum Sell Prior Probability Maximum
Bayes’ Decision Rule: Using the best available estimates of the probabilities of the respective states of nature (currently the prior probabilities), calculate the expected value of the payoff for each of the possible actions. Choose the action with the maximum expected payoff.
Bayes’ Decision Rule E[Payoff(drill)] = 0.25(700) + 0.75(-100) = 100 E[Payoff(sell)] = 0.25(90)+0.75(90) = 90 State of Nature Expected Payoff Alternative Oil Dry Maximum Drill -100 90 0.75 100 90 700 90 0.25 Sell Prior Probability
Sensitivity Analysis with Bayes’ Decision Rule The true prior probability of having oil is likely to be in the range from 0.15 to 0.35, so the corresponding prior probability of the land being dry would range from 0.85 to 0.65. P = prior probability of oil the expected payoff from drilling for any p is E[Payoff(drill)] = 700p - 100(1 - p) = 800p - 100.
Region where the decision should be to drill for oil Region where the decision should be to sell the land 700 600 Expected payoff (EP) 500 Drill for oil 400 300 200 Prior probability of oil 100 0 0.8 0.2 0.4 0.6 1.0 -100 Prior probability of oil Crossover point
To find a crossover point E[Payoff(drill)] = E[Payoff(sell)] 800p - 100 = 90 Conclusion: Should sell the land if p < 0.2375. Should drill for oil if p > 0.2375.
Decision Making with Experimentation There is an available option that is to conduct a detailed seismic survey of the land to obtain a better estimate of the probability of oil. The cost is $30,000. A seismic survey obtains seismic soundings that indicate whether the geological structure is favorable to the presence of oil.
U: Unfavorable seismic soundings; oil is fairly unlikely. F: Favorable seismic soundings, oil is fairly likely. Based on past experience, if there is oil, P(U|State=Oil)=0.4, so P(F|State=Oil)=0.6 If there is no oil, P(U|State=Dry)=0.8, so P(F|State=Dry)=0.2
Bayes’ theory Si: State of Nature (i = 1 ~ n) P(Si): Prior Probability Fj: Professional Information (Experiment)( j = 1 ~ n) P(Fj | Si): Conditional Probability P(Fj Si) = P(Si Fj): Joint Probability P(Si | Fj): Posterior Probability P(Si | Fj)
Expected payoffs if finding is unfavorable seismic soundings (U): E[Payoff(drill|Finding=U)] E[Payoff(sell|Finding=U)]
Expected payoffs if favorable seismic soundings (F): E[Payoff(drill|Finding=F)] E[Payoff(sell|Finding=F)]
To maximize the expected payoff, Expected Payoff Excluding Cost of Survey Finding from Seismic Survey Optimal Action USS FSS Sell the land Drill for oil 90 (60 + 30) 300 (270 + 30) However, what this analysis does not answer is whether it is worth spending $30,000 to conduct the experimentation (the seismic survey).
The Value of Experimentation Expected Value of Perfect Information (EVPI): EVPI = expected payoff with perfect information expected payoff without experimentation. Since experimentation usually cannot provide perfect information, EVPI provides an upper bound on the expected value of experimentation.
Expected payoff with perfect information = 0.25(700) + 0.75(90) = 242.5. Expected payoff without experimentation = 0.25(700) + 0.75(-100) = 100 ( > 90) (By Bayes’ decision rule) EVPI = 242.5 - 100 = 142.5. Since 142.5 far exceeds 30, the cost of experimentation, it may be worthwhile to proceed with the seismic survey.
P(U) = P(O)P(U | O)+P(D)P(U | D) = (0.25)(0.4)+ (0.75)(0.8) = 0.7 P(F) = P(O)P(F | O)+P(D)P(F | D) = (0.25)(0.6)+(0.75)(0.2) = 0.3 E(Payoff|Finding = U) = 90, E(Payoff|Finding = F) = 300, Expected payoff with experimentation = 0.7(90)+0.3(300) = 153.
Expected Value of Experimentation (EVE): EVE = expected payoff with experimentation expected payoff without experimentation. EVE = 153 - 100 = 53. Since this value exceeds 30, the cost of conducting a detailed seismic survey, this experimentation should be done.
Decision Trees The nodes of the decision tree are referred to as nodes, and the arcs are called branches. A decision node, represented by a square, indicates that a decision needs to be made at that point in the process. A chance node, represented by a circle, indicates that a random event occurs at that point.
decision node chance node Oil Drill f Dry c Unfavorable Sell Oil b Do seismic survey g Drill Dry d Favorable Sell a Oil h Drill Dry e No seismic survey Sell
Payoff Oil(0.143) 670 Drill 800 f -100 0 Unfavorable(0.7) -130 c Dry(0.857) 90 60 0 Sell Oil(0.5) b 670 Drill Do seismic survey 800 g 0 -100 -30 0 -130 Dry(0.5) d Favorable(0.3) 90 60 Sell a Oil(0.25) 700 Drill 800 0 h -100 0 -100 No seismic survey Dry(0.75) e 90 90 Sell
Performing the Analysis 1. Start at the right side of the decision tree and move left one column at a time. For each column, perform either step 2, or step 3. 2. For each chance node, calculate its Expected Payoff (EP). Record the EP, and designate this quantity as also being the EP for the branch leading to this node. 3. For each decision node, compare the EP of its branches and choose the alternative whose branch has the largest EP. Record the choice by inserting a double dash as a barrier.
Payoff For each chance node, Expected Payoffs (EP) are calculated as Oil(0.143) -15.7 670 Drill f -130 Dry(0.857) 60 Oil(0.5) 270 670 Drill g -130 Dry(0.5) 60 Oil(0.25) 100 700 h -100 Dry(0.75) 90
Payoff -15.7 Drill alternative has EP = -15.7. Sell alternative has EP = 60. 60 > -15.7, so choose the Sell. Drill has EP = 270. Sell has EP = 60. 270 > 60, so choose the Drill. Drill has EP = 100. Sell has EP = 90. 100 > 90, so choose the Drill. Drill f 60 c 60 Sell 270 Drill g 270 d 60 Sell 100 Drill h 100 e 90 Sell
60 Unfavorable(0.7) Do seismic survey c 123 EP = 0.7(60) + 0.3(270)=123 b 270 d 123 Favorable(0.3) a Do seismic survey has EP = 123 No seismic survey has EP = 100 123 > 100, so choose Do seismic survey. 100 e No seismic survey
-15.7 Payoff Oil(0.143) 670 Drill Unfavorable(0.7) 800 f 60 -100 0 -130 c Dry(0.857) 90 Do seismic survey 60 123 0 Sell Oil(0.5) 270 b 670 Drill 800 g 0 270 -100 -30 0 -130 Dry(0.5) d 123 Favorable(0.3) 90 60 Sell a 100 Oil(0.25) 700 Drill 800 0 h 100 -100 0 -100 Dry(0.75) e No seismic survey 90 90 Sell
Optimal policy: Do the seismic survey. If the result is unfavorable, sell the land. If the result is favorable, drill for oil. The expected payoff (including the cost of the seismic survey) is 123 ($123,000).
For any decision tree, this backward induction procedure always will lead to the optimal policy after the probabilities are computed for the branches emanating from a chance node.