Download
1 / 13
130 likes | 154 Views
Learn how PCA simplifies data by replacing intercorrelated variables with a smaller number of variables. Calculate principal components, component scores, and estimate values for unmeasured variables. Use PCA for age estimation, classifying plant communities, and discriminant function analysis.

E N D
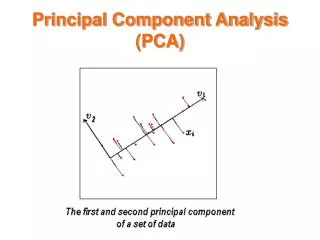
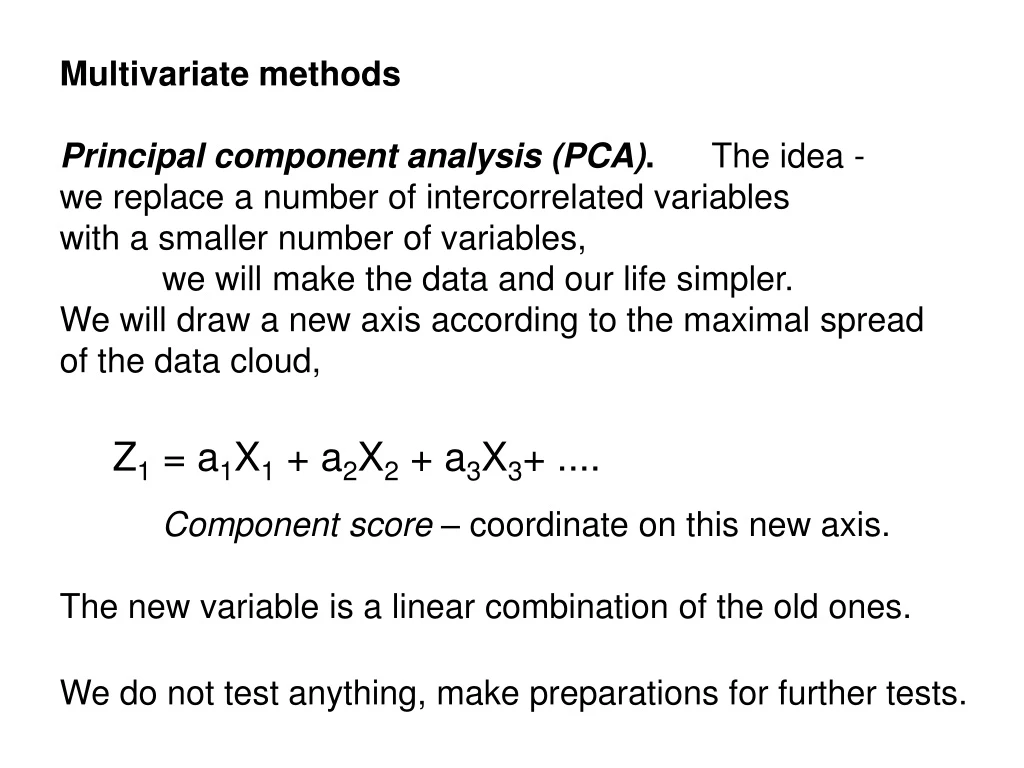
Multivariate methods Principal component analysis (PCA). The idea - we replace a number of intercorrelated variables with a smaller number of variables, we will make the data and our life simpler. We will draw a new axis according to the maximal spread of the data cloud, Component score – coordinate on this new axis. The new variable is a linear combination of the old ones. Z1 = a1X1 + a2X2 + a3X3+ .... We do not test anything, make preparations for further tests.
Calculating one principal component The (adult) age of a butterfly caught in the wild, - cannot be directly measured, Following variables correlate with it but do not measure it: - wear; - damage; - capture date. no wear damage date size eggslaid
All correlate with each ohter: We will „merge“ them to one principal component. Coordinate on the new axis is the estimated age, will be used in further analyses. wear damage date size wear damage date size
PCA gives the following results: age = 0,56*wear+0,58*damage+0,59*date+0,02*size for each observation: 1 -2.48 2 -2.74 3 -0.64 4 -0.28 5 0.30, do not worry about the minus wear damage date size
no wear damage date size eggslaid „age“
eggs laid estimated age Use when the value of a variable cannot be measured - for technical reasons; - in principle.
Principal component is the axis of data cloud, there can be several, orthogonal to each other! Two principal components: classifying plant communities. Objects: forest patches; measured variables: abundances of different plant species; variables being estimated: parameters of the forest patches. Let there be two – humidity and fertility, calculate two PC and respective PC scores so that: Z1 = a1,1X1 + a1,2X2 + a1,3X3+ .... Z2 = a2,1X1 + a2,2X2 + ..…
Ordination plot: fertility humidity
fertility Biplot: nettle heather humidity
Canonical correspondence analysis fertility CCA biplot humidity light
Discriminant function analysis (DFA) - we know in advance in which classes objects belong; • which new variable - a linear combination of original variables best allows to discriminate between the species. Z1 = a1,1X1 + a1,2X2 + a1,3X3+ .... • each object has a a coordinate on this axis, and there is a critical value according to which the decision is made.