Download
1 / 44
440 likes | 588 Views
Assembly, Comparison, and Annotation of Mammalian Genomes. David Haussler Howard Hughes Medical Institute University of California, Santa Cruz. Bioinformatics of mammalian genomes. Sequence Assembly. Genome Browsers: new computational microscopes.

E N D
Assembly, Comparison, and Annotation of Mammalian Genomes David HausslerHoward Hughes Medical Institute University of California, Santa Cruz
Bioinformatics of mammalian genomes • Sequence Assembly • Genome Browsers: new computational microscopes • Computing Evolution’s Path: key to understanding function
Assembling the human genome • GigAssembler (Kent) • Built first draft of the human genome from lower-level contigs produced by Phrap( P. Green) • Celera Assembler (Myers/Sutton) • First mammalian whole genome shotgun assembler Outgoing UCSC internet traffic (green) for year 2000. Main peak is activity on July 7, 2000 when human sequence was first posted on the web
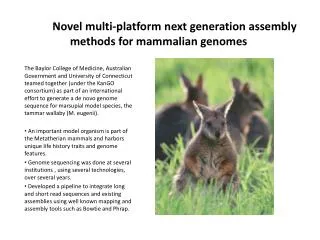
Assembling other mammalian genomes • Arachne (Jaffe/Batzolou, Lander group at MIT) • Built first draft of mouse genome, February 2002 • Mouse also assembled by Phusion assembler (Mullikin, Sanger Centre) • Atlas (Havlak/Chen/Durbin, Gibbs group at Baylor) • Built first draft of rat genome, November 2002
Browsers as web-based genome microscopes • Ensembl Browser (Birney et al.) • MapViewer (NCBI Mapviewer team) • UCSC Genome Browser (Kent et al.) http://genome.ucsc.edu, currently getting more than 140,000 page requests per day
. . . and at the single base level caggcggactcagtggatctggccagctgtgacttgacaag caggcggactcagtggatctagccagctgtgacttgacaag
linking to functional information In situ image from I. Dragatsis et al. 1998
Goal: the browser as a continuously-tuned engine for discovery • Multiple streams of high-throughput genomics data generated asynchronously • Data fed into nightly updates of browser database, analysis and display • Browser becomes a new kind of microscope scanning the genome at ever greater detail, dimension, and depth
Using evolution to find genes and other functional elements Mouse conservation pattern in the IGFALS gene on human chr. 16 and a known transcription factor binding site R. Weber, L. Elnitski et. al.
At least half of the human genome consistsof relics of retrotransposons
Ancestral retrotransposons • Retrotransposon relics from our common ancestor with mouse and other placental mammals • They cover 22% of the human genome • “AR” sites can be used to study neutral evolution: mutation without selection • “AR” sites are similar to “4D” sites in genes (four-fold degenerate sites in codons)
Estimated rate of neutral substitution from AR and 4D sites co-varies along the chromosomes R. Hardison, K. Roskin, S, Yang, A. Smit, et al.
By comparison to local neutral substitution rates, it appears that about 5% of the human genome may be under purifying selection. K. Roskin, R. Weber, F. Chiaromonte
Human Chimp Baboon Cat Dog Pig Cow Rat Mouse Chicken Zebrafish Fugu Tetraodon More species increases power to detect conserved elements BROWSER SNAPSHOT About 4% of CFTR region is under purifying selection Data from Eric Green at NGHRI, alignments by Webb Miller
Models of molecular evolution Branch length equals average number of substitutions per site
Models of molecular evolution Branch length equals average number of substitutions per site A
Models of molecular evolution Branch length equals average number of substitutions per site A A G
Models of molecular evolution Branch length equals average number of substitutions per site T A A A G G G
Models of molecular evolution T Branch length equals average number of substitutions per site T T A A A G G G
Models of molecular evolution T Branch length equals average number of substitutions per site T T A A A G G G
Continuous-time Markov models ofmolecular evolution can be used tocalculate p-values for conservation Conditional probability distribution on each branch has the form P = eQt where t is the time and Q is a 4 by 4 rate matrix. Parameterizations of Q: JC, …, HKY, REV, UNR
Calculation of p-values • p-value is probability of getting a given parsimony score or better, using a cont. time Markov model of evolution • p-values are calculated recursively for the two subtrees, for all possible values of parsimony score and ancestral bases for each subtree • data for subtrees is combines to produce p-value at root Method developed by Mathieu Blanchette and Martin Tompa
Calculation of p-values • p-value is probability of getting a given parsimony score or better, using a cont. time Markov model of evolution • p-values are calculated recursively for the two subtrees, for all possible values of parsimony score and ancestral bases for each subtree • data for subtrees is combines to produce p-value at root Method developed by Mathieu Blanchette and Martin Tompa
Calculation of p-values • p-value is probability of getting a given parsimony score or better, using a cont. time Markov model of evolution • p-values are calculated recursively for the two subtrees, for all possible values of parsimony score and ancestral bases for each subtree • data for subtrees is combines to produce p-value at root Method developed by Mathieu Blanchette and Martin Tompa
Examples of conserved regions Analysis of CFTR region by Mathieu Blanchette
Regulatory modules Mathieu Blanchette
Conserved RNA structure in a 3’ UTR Mathieu Blanchette
Intronic RNA structural element 73kb to ST7 1st exon 73kb to ST7 2nd exon ~90 bp conserved stem Mathieu Blanchette
Modeling different modes of substitution We want to pay attention to how elements are conserved, not just that they are conserved
Context matters substitution rate matrix for non-coding dinucleotides Adam Siepel
Dinucleotide and trinucleotide models fit substitution data from neutral regions much better Improvement in log likelihood on AR sites for higher order models of base substitution Adam Siepel
Method also produces improved models of codon evolution Adam Siepel
Phylogenetic HMMs TAATGGTA…CCAGTTA…GCAGAGT… human TAATGGTA…CCGGTTA…ACAGAGT… baboon CGATGGTG…CCGGTCG…ACAGAGC… mouse CTATGGTC…CCTGTTA…TCAGAGC… dog GTATGGTC…CCTGTCG…TCAGAGC… cat CCATGGTT…CCCGTAG…CCAGAGT… cow pig CCATGGTT…CCCGTAG…CCAGAGT… chicken TTATGGTA…CCTGTTA…ACAGAGT… Adam Siepel
Comparative cDNA analysis finds alternatively spliced genes Human splice variants of ZNF278 conserved in mouse Chuck Sugnet
Molecular evolution is morethan base substitutions • Insertions • Deletions • Duplications • Inversions • Rearrangements
Genome-wide human-mouse alignments reveal a host of multibase evolutionary events A 15,000 base inversion on human chromosome 7 containing two genes J. Kent, W. Miller, R. Baertsch
Hot spots for rearrangements? At finer resolution, many thousands of syntenic blocks between human and mouse are found, and short blocks are clustered in clumps J. Kent, W. Miller, R. Baertsch
Grand challenge of humanmolecular evolution Reconstruct the evolutionary history of each base in the human genome
Credits Thanks to Jim Kent, Terry Furey, Mathieu Blanchette, Adam Siepel, Chuck Sugnet, Ryan Weber, Krishna Roskin, Mark Diekhans, Robert Baertsch, Matt Schwartz, Angie Hinrichs, Donna Karolchik, Heather Trumbower, Yontao Lu, Fan Hsu, Daryl Thomas, Jorge Garcia, Patrick Gavin and Paul Tatarsky at UCSC Francis Collins, Bob Waterston, Eric Lander, Richard Gibbs, Eric Green, Elliot Margulies, David Kulp, Alan Williams, Ray Wheeler, Webb Miller, Ross Hardison, Scott Schwartz, Francesca Chiaromonte, Thomas Pringle, Greg Schuler, Deanna Church, Steve Sherry, Ewan Birney, Michelle Clamp, David Jaffe, Asif Chinwalla, Jim Mullikin,Tim Hubbard, Arian Smit, Nick Goldman, Barbara Trask, Ian Dunham, Sean Eddy, Evan Eichler, David Cox, Carol Bult, and many other outside collaborators