Download
1 / 12
120 likes | 146 Views
Study of ionospheric convection patterns in the Northern hemisphere during a northward IMF period using SuperDARN radar network and Cluster satellite data.

E N D
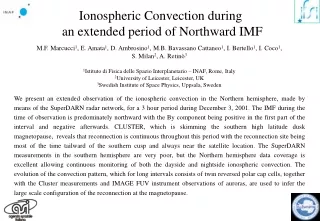
Ionospheric Convection during an extended period of Northward IMF M.F. Marcucci1, E. Amata1, D. Ambrosino1, M.B. Bavassano Cattaneo1, I. Bertello1, I. Coco1, S. Milan2, A. Retinò3 1Istituto di Fisica delle Spazio Interplanetario – INAF, Rome, Italy 2University of Leicester, Leicester, UK 3Swedish Institute of Space Physics, Uppsala, Sweden We present an extended observation of the ionospheric convection in the Northern hemisphere, made by means of the SuperDARN radar network, for a 3 hour period during December 3, 2001. The IMF during the time of observation is predominately northward with the By component being positive in the first part of the interval and negative afterwards. CLUSTER, which is skimming the southern high latitude dusk magnetopause, reveals that reconnection is continuous throughout this period with the reconnection site being most of the time tailward of the southern cusp and always near the satellite location. The SuperDARN measurements in the southern hemisphere are very poor, but the Northern hemisphere data coverage is excellent allowing continuous monitoring of both the dayside and nightside ionospheric convection. The evolution of the convection pattern, which for long intervals consists of twin reversed polar cap cells, together with the Cluster measurements and IMAGE FUV instrument observations of auroras, are used to infer the large scale configuration of the reconnection at the magnetopause.
Dayside Ionospheric Convection Pattern and IMF orientationThe Northern hemisphere coverage of the SuperDARN data during this period is excellent. Each convection map in the interval 0730-1030 UT has been inspected to infer the type of dayside convection around 12 MLT and study its possible dependence on the interplanetary conditions. The colour coded bar has been used to present the information on the type of convection in a compacted way and the colour meaning is described below.
0730 - 0732 Yellow indicates the presence of a clockwise dawn polar cap cell, due to By positive lobe reconnection, usually observed simultaneously with a post noon sunward-dawnward flow which can be interpreted as the effect of high latitude dayside component reconnection for positive IMF By. Blue indicates an anti-clockwise dusk polar cap cell, due to By negative lobe reconnection, sometimes observed simultaneously with a pre noon sunward-duskward flow which can be interpreted as the effect of high latitude dayside component reconnection for negative IMF By. Green indicates that the convection around 12 MLT is due eastward or westward. For the period under study it is westward for By positive and eastward for By negative. Red indicates the presence of two reverse convection cells. When they are symmetric the red bar is marked with a black rectangle. Before the two cell become symmetric at 0856 UT, they are highly distorted with respect to the noon midnight meridian and the dawn cell seems to prevail on the dusk one. After 0920 UT the dusk cell is larger than the dawn one. Note that sunward flow is still present at the lower latitudes at noon. 0946 - 0948 By < 0 1114 - 1116 By > 0 0748 - 0750 0904 - 0906 0844 - 0846 0936 - 0938
? ? Double Northward IMF Reconnection Looking at the time evolution of the ionospheric convection, if we interpret the presence of polar cap cells and/or twin reversed cells as the effect of lobe reconnection, it appears thatNorthern lobe reconnection is continuously going on whenever the IMF is Northward. On the other hand, CLUSTER reveals that reconnection is continuous throughout this period with the reconnection site being most of the time tailward of the southern cusp and always near the satellite location.
Is reconnection going on simultaneously tailward of both cusps? In this case we expect that open polar cap flux is transformed in closed dayside flux, therefore we should observe 1) sunward flow crossing the open – closed boundary (OCB) and 2) eventually a poleward motion of this boundary. Newly Closed Lobe reconnection line projection Open- Closed Field Line Boundary IMF Newly Opened Double Reconnection tailward of the Northern and Southern Cusps One Lobe Reconnection
Assuming that the auroral oval gives us an indication of the OCB position, we made the keogram of the IMAGE S13 observations in the interval 14.5 – 15.5 MLT. At this local time, we generally observe the most intense sunward and westward flows for the period after 0820 UT. We try to highlight the movement of the maximum auroral luminosity. The red lines are meant to evidence them. It seems that in the period 0820 1000 UT, 6 poleward movements of the auroral maximum can be identified. The duration of the polward movement ranges from 4 to 10 minutes. Dayside convection maps during the poleward movements of the auroral oval are reported on the right column, while convection maps nearby to these intervals are reported in the left column. It seems that poleward movement of the auroral oval tend to be correlated with periods when the velocity perpendicular to the auroral oval is enhanced and the flow seems to cross such boundary. We interpret these observations as the results of lobe flux re-closure at a variable rate.
Nightside Transpolar arcs, Ionospheric Convection and Tail Reconnection A transpolar arc is visible on IMAGE data throughout much of the event (Principal transpolar arc, Ptpa), and a second transpolar arc develops, but not completely, during the time of observations (Secondary transpolar arc, Stpa). The IMAGE WIC keogram is reported in the figure. This keogram is composed, for each time of observations, by 8 WIC horizontal slices crossing the midnight meridian approximately every 1° in magnetic latitude in the interval from 74° to 80°. This is necessary because the Ptpa luminosity at 90° magnetic latitude is very weak for most of the time, on the other hand its dynamics at higher latitude is generally related to the motion of the low latitude portion. Before 0720 no FUV data are available.
During the period under study the Ptpa remains stable until 0756 UT, then starts to move duskward. This motion seems to be faster in the interval 0756 – 0820 UT, with respect to the interval 0820 - 0920 UT and is very slow during the interval 0920 - 1018 UT, after which the Ptpa disappears. In the interval 0824 - 0840 UT, the luminosity of the Ptpa is very weak, even if the Ptpa is continuously present. At about 0840 the arc is again well defined ad its luminosity intensifies until 0910 UT. In the figure the movement of the Ptpa has been highlighted with red lines. In the WIC keogram the Stpa appears only as a fading shape in-between the Ptpa and the duskside auroral oval in the interval 0900 - 1000 UT, since it hardly reaches 75° MLAT even when it is fully developed. In the figure below, the keogram of S13 data with 18 – 06 MLT x 70 – 80 MLAT slices is reported. Here it is evident that the Stpa appears at about 0848 UT, is very weak in the interval 0906 – 0930, and disappears after 1000 UT.
The movements and the luminosity variability of the two transpolar arcs are correlated with the ionospheric plasma convection measured by the SuperDARN data. Regarding the Ptpa in the interval 0720 - 0842 UT, below are reported typical convection patterns for the periods a, b, c, identified in the keogram, plotted over the corresponding S13 images. In the first interval convection over the Ptpa is characterized by relatively low velocities; in the interval b velocities over the Ptpa are enhanced and directed weastward, the luminosity of the Ptpa is lower than in the previous interval; in the interval c, the velocity over the Ptpa are lower with respect to the previous period and directed antisunward, the Ptpa’s luminosity is further decreased. a b c
Convection patterns regarding the movements and luminosity variability of both the two arcs after 0840 UT are reported below for 12 specific times. Until 0834 UT the convection is similar to the convection reported in panel c. At 0834 UT the antisunward velocity in the dawn night side sector decreases and becomes sunward at 0838 UT. It is at this time that the luminosity of the Ptpa starts to enhance, even if it is not evident from the keogram. In this convection map it seems also that flows change at 70 MLAT around 21 MLT, becoming more antisunward. This situation lasts until 0850, when enhanced weastward flows appears in the nightside. This flows seems to skip the very low latitude part of Ptpa and the Stpa . Such flows remains until 0906 UT when the antisunward flows observed in proximity of the Stpa disappears, and the weastward velocity seems to increase. Note, however that the low latitude part of the Ptpa is always characterized by very slow flows. This convection pattern remains until 0926 UT, apart for the convection map of 0918 UT, and although the velocity of the weastward jets is reduced at the end. At 0926 UT, the antisunward flows at the Stpa end are again evident, and this situation lasts until 0944UT, apart from the convection map of 0932. At 0944 the antisunward flows which can be observed near the noon midnight meridian in the night side seem to be part of the dusk large scale anticlockwise cell that set up at this time. To summarize: 1) the Ptpa luminosity starts to increase in coincidence with the sunward flows period starting at 0838 UT, whereas it has been decreasing during the preceding time of observations, when the flows above the arc remain steadly antisunward or weastward. As already said, the enhanced weastward flows of 0906 -0918 UT skip the low latitude part of the Ptpa, so that only its high latitude part continues to move weastward, as evident in the WIC keogram; 2) when sunward flows are observed near the poleward portion of the Stpa, that is during 0850 – 0906 UT and 0926 – 0942 UT, the luminosity of this arc is enhanced, as it can be observed from the S13 keogram.
Summary and Conclusion • During December 3, 2001 the IMF pointed steadly Northward for a long time period, until it rotated dawnward in the last part of the interval. Cluster observations evidence that reconnection is occurring continuously between lobe field lines and the external magnetic field in the Southern Hemisphere (Retinò et al., 2005), in agreement with the orientation of the IMF. • SuperDARN and IMAGE observations of the Northern Hemisphere polar convection and auroral features provide evidence that: • Lobe reconnection is occuring at the Northern Hemisphere despite the fact that Bx positive and dipole tilt unfavourable, contrary to predictions of Crooker, 1979 and Crooker and Rich, 1993. • Northern lobe reconnection is continuously going on whenever the IMF is Northward. • Large scale reconnection configuration at the magnetopause is determined by the orientation of the IMF (contrary to local condition at the magnetopause). • Lobe flux re-closure (Song et al. 1992, Onsager et al., 2001) is occurring at a variable rate as evidenced by poleward movements of the OCB when sunward flows across it are enhanced. • Moreover a transpolar arc is visible on IMAGE data throughout much of the event and a second transpolar arc develops, but not completely, during the time of observations : • This confirms the results of Cumnock et al. 2005 which noted that theta aurora are almost always formed in the Northern Hemisphere, regardless of Bx positive and dipole tilt unfavourable like in this case. • The Ptpa moves from dusk to dawn almost steadily from 0750 until approximately 0950 when lobe reconnection transports flux from dusk to dawn. After 0950 UT the convection changes, and flux is moved from dawn to dusk. The TPA during this period remains close to the noon – midnight meridian. These observations shows how the TPA movement is dependent on lobe reconnection configuration (Vallarades, 1994; Milan, 2005). • The luminosity enhancements of the two arcs in correspondence with sunward nightside flows are interpreted as localized geomagnetic tail reconnections creating closed flux which intrudes in the night side polar cap. • Therefore polar cap flows, which are the effect of dayside/lobe reconnection, drives the movements of the polar cap arcs in the interval 0750 - 0950, but sometimes the rate of tail reconnection is such that the polar cap flow are diverted from the presence of the TPAs (e.g 0838 UT).