Download
1 / 20
210 likes | 429 Views
Interactive web-based pointillist visualization of hydrogenic orbitals using Jmol. Robert M. Hanson (St. Olaf College) Robert Caldwell, Brian Hardock, Pshemak Maslak, Thomas Stitt, Shane Tully (Penn State) BCCE 22 Penn State University Thursday, Aug. 2, 2012.

E N D
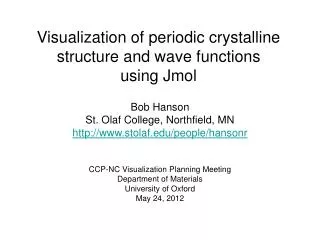
Interactive web-based pointillist visualization of hydrogenic orbitals using Jmol Robert M. Hanson (St. Olaf College) Robert Caldwell, Brian Hardock, Pshemak Maslak, Thomas Stitt, Shane Tully (Penn State) BCCE 22 Penn State University Thursday, Aug. 2, 2012
Background: “Molecular Origami” • St. Olaf College Chemistry 123 • Start with hand-held models • Develop concepts as needed http://www.stolaf.edu/people/hansonr/mo
CoolMolecules Project Outcomes: the site http://www.stolaf.edu/depts/chemistry/mo/struc
CoolMolecules Project Outcomes: interface http://www.stolaf.edu/depts/chemistry/mo/struc
CoolMolecules Search Results: tabulation http://www.stolaf.edu/depts/chemistry/mo/struc
Atomic Orbitals in General Chemistry “The center of Figure 3 shows what may be called a ‘foggy plot’…. The image conveys the spatial fuzziness of orbitals better than the isosurface plot, and is not as easily mistaken for the aforementioned ‘balloon in which electrons bounce around’. However, the fuzziness of the plot also makes it less convenient for orbital visualizations in research papers. The author recommends the juxtaposition of isosurface and ‘foggy’ plots when orbital graphics are first shown to students.”
Hydrogenic Orbital Explorer http://chemapps.stolaf.edu/jmol/orbitals
Hydrogenic Orbital Explorer http://chemapps.stolaf.edu/jmol/orbitals
Hydrogenic Orbital Explorer http://chemapps.stolaf.edu/jmol/orbitals
Hydrogenic Orbital Explorer http://chemapps.stolaf.edu/jmol/orbitals
Hydrogenic Orbital Explorer http://chemapps.stolaf.edu/jmol/orbitals
Hydrogenic Orbital Explorer http://chemapps.stolaf.edu/jmol/orbitals
Hydrogenic Orbital Explorer http://chemapps.stolaf.edu/jmol/orbitals
Hydrogenic Orbital Explorer http://chemapps.stolaf.edu/jmol/orbitals