Download
1 / 19
190 likes | 327 Views
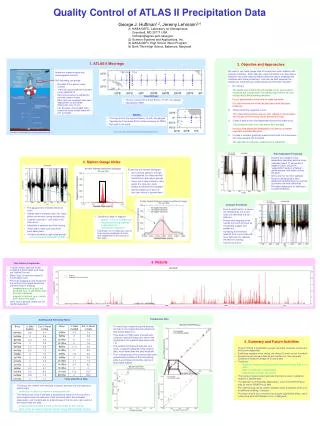
Quality Control of the ATLAS II Precipitation Gauge Data. Jeremy Lehmann Beth Tfiloh High School, Grade 12 Mentor: Dr. George Huffman Mesoscale Atmospheric Processes Branch: Code 613.1. Acknowledgements. Dr. George Huffman Dr. Yolande Serra Dr. Tom Bell Dr. Robert Adler. Global Rainfall.

E N D
Quality Control of the ATLAS II Precipitation Gauge Data Jeremy Lehmann Beth Tfiloh High School, Grade 12 Mentor: Dr. George Huffman Mesoscale Atmospheric Processes Branch: Code 613.1
Acknowledgements • Dr. George Huffman • Dr. Yolande Serra • Dr. Tom Bell • Dr. Robert Adler
Global Rainfall • A variety of satellites estimate precipitation across the world • Validation from the ground is essential to verify accuracy of satellites TRMM PR (red) TRMM TMI (cyan) SSM/I (3 sat.; yellow) AMSR-E (blue) AMSU-B (3 sat.; green) IR (black) Adapted from Huffman, et al. 2006.
TRMM Combination Rainfall Loop TRMM Combination Global Rainfall Estimates: Aug. 3, 2006 - Aug. 10, 2006 Accessible at http://trmm.gsfc.nasa.gov
TAO/TRITON Array • Array of 70 moored buoys across the Pacific Ocean, 8o N to 8o S, 137o E to 95o W • Operated by PMEL • Contain a multitude of instruments that measure wind speed, air temperature, and sea surface temperature • 27 buoys contain rain gauges Available from PMEL Website: http://www.pmel.noaa.gov/tao/
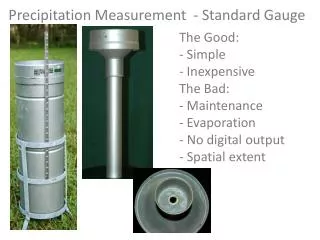
ATLAS II Self-Siphoning Rain Gauges • Mounted 3.5 m. above ocean surface • Rainfall rates are compiled after each deployment • Rainfall accumulations recorded every min., differenced over 10 min. • Dr. Ken Bowman combined these rainfall rates into 3 hr. periods Available from PMEL Website: http://www.pmel.noaa.gov/tao/
Rain gauges have inherent noise Creates negative as well as false positive values Objectives Characterize Noise Determine the threshold needed to eliminate noise from buoys Instrument Noise
Noise • Episodic and not constant • Varies within each buoy and within each deployment • Oscillates across zero during dry periods • Contain anomalous periods
Distribution clusters around zero Peak of rainfall rate distribution, however, is negative Attributed to evaporation On the order of -.001 to -.008 mm/h Value is on order of previously calculated monthly evaporation rate Rainfall Distribution Histogram
Time Dependent Threshold • Determined by calculating 10th percentile of negative values, incorporating evaporation value, and reflecting across origin • No statistical result as threshold varies too much • Provided general area of threshold
Determining Constant Threshold • Noise vs. Light Rain Events • How much data can be discarded? IMAGE OF SERIES AND DIFFERENT LINES OF DIFFERENT THRESHOLDS
Results • Decided .2 mm/h as set threshold for each buoy • Anomalous periods defined as periods of data in which noise above the threshold contributed to more than 4% of total data • Threshold effectively eliminated the noise
Results Cont. * Only 3 Months of Data
Results Cont. • Thresholded rain rate very similar to original rain rate
Conclusion • Noise in ATLAS II precipitation gauges is greatly varies and generally oscillates across zero • Using negative noise values, we chose .2 mm/h as our threshold • Threshold • Effectively eliminates noise (generally accounts for less than 3%of data) • Thresholded data closely aligned with original data • Anomalous periods were defined and did not constitute large percentage of data • Threshold does discard very light rain events
Future Applications • Provides revised data sets used in validation with satellites • Methodology can be used to lower threshold if needed • Principles can be applied to future TAO/TRITON buoy data as well as PIRATA buoy data in the Atlantic
Intern Experience • Fueled my passion for meteorology • Learned importance of math and physics as well as presentation and writing skills • Through my research, attendance at Earth Science seminars and conversations with other meteorologists, I’ve witnessed the breadth of the field • Realized the tremendous opportunity at NASA to perform research in Earth Science and that there is much to be discovered about our planet
Acronyms • AMSU B: Advanced Microwave Sounding Unit-B • AMSR-E: Advanced Microwave Scanning Radiometer for Earth Observing System • ATLAS: Autonomous Temperature Line Acquisition System • IR: Infrared • NASA: National Aeronautics and Space Administration • PIRATA: Pilot Research Array in the Tropical Atlantic • PMEL: Pacific Marine Environmental Laboratory • PR: Precipitation Radar • SSM/I: Special Sensor Microwave Imager • TAO/TRITION: Tropical Atmosphere Ocean / Triangle Trans-Ocean Buoy Network • TMI: TRMM Microwave Imager • TRMM: Tropical Rainfall Measuring Mission
References Bowman, K. P., 2004. Comparison of TRMM Precipitation Retrievals with Rain Gauge Data from Ocean Buoys. J. Climate., 18, 178-190. Huffman, G. J., R. F. Adler., D. T. Bolvin, G. Gu, E. Nelkin, K. P. Bowman, Y. Hong, E. F. Stocker, and D. B. Wolff, 2006. The TRMM Multi-satellite Precipitation Analysis (TMPA): Quasi-Global, Multi-Year, Combined Sensor Precipitation Estimates at Fine Scales. To appear in J. Hydrometeorology. McPhaden, M. J., 2006. Tropical Atmosphere Ocean Project. http://www.pmel.noaa.gov/tao. Pierce, H., 2006. TRMM: Tropical Rainfall Measuring Mission. http://trmm.gsfc.nasa.gov. Serra, Y. L. and M. J. McPhaden, 2002. Multiple Time and Space Scale Comparisons of ATLAS Buoy Rain Gauge Measurements to TRMM Satellite Precipitation Measurements. Submitted to J. Appl. Meteor. Serra, Y. L., P. A’Hearn, H. P. Freitag, and M. J. McPhaden, 2001. ATLAS Self- Siphoning Rain Gauge Error Estimates. J. Atmos. Iceanic Technol., 18, 1989-2002.