Download
1 / 42
420 likes | 545 Views
This preliminary report by the Institute for Social and Economic Research (ISER) explores the critical transitions of Alaska Natives from 2000 to 2010. Highlighting demographic changes, the report reveals a relatively young population grappling with unique challenges, diverse regional dynamics, and a significant portion living outside of Alaska. It notes trends such as increased multi-ethnicity and varied growth rates across regions and age groups. This analysis serves as a foundational overview of where we are, how we have changed, and potential future directions for Alaska Native communities.

E N D
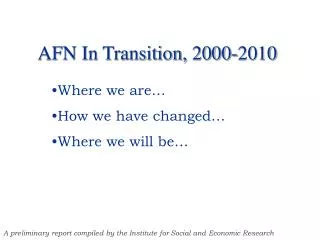
AFN In Transition, 2000-2010 Where we are… How we have changed… Where we will be… A preliminary report compiled by the Institute for Social and Economic Research
Where we are… A Snapshot of Alaska Natives in 2000 • Relatively young population facing unique challenges and change • Large regional differences in demographic composition and patterns of change • Roughly equal distribution of male and female Native Alaskans • Large share of Alaska Natives live outside of Alaska AFN in Transition, 2000-2010
2000 Race /Ethnicity Question – select all appropriate ethnic backgrounds 6. What is this person's race? Mark [X] one or more races to indicate what this person considers himself/herself to be. O White O Black, African Am., or Negro O American Indian or Alaska Native - Print name of enrolled or principal tribe. _________________________ O Asian Indian O Chinese O Filipino O Japanese O Korean O Vietnamese O Other Asian - Print race. ___________________________ O Native Hawaiian O Guamanian or Chamorro O Samoan O Other Pacific Islander - Print race. _____________________________ O Some other race - Print race. _____________________________ Where we are… A Snapshot of Alaska Natives in 2000 AFN in Transition, 2000-2010
Where we are … 2000 Population Overview AFN in Transition, 2000-2010
1990 Race /Ethnicity Question – self-select a single ethnicity 4. Race Fill ONE circle for the race that the person considers himself/herself to be. If Indian (Amer.), print the name of the enrolled or principal tribe. If Other Asian or Pacific Islander (API), print one group, for example: Hmong, Fijian, Laotian, Thai, Tongan, Pakistani, Cambodian, and so on. If Other race, print race. O White O Black or Negro O Indian (Amer.) (Print the name of the enrolled or principal tribe.) _________________________ O Eskimo O Aleut Asian or Pacific Islander (API) O Chinese O Japanese O Filipino O Asian Indian O Hawaiian O Samoan O Korean O Guamanian O Vietnamese O Other API ↓ ____________________ O Other race (Print race) _________________________ Where we are… A Snapshot of Alaska Natives in 2000 AFN in Transition, 2000-2010
Where we are… A Snapshot of Alaska Natives in 2000 AFN in Transition, 2000-2010
Source: ISER Where we are … 2000 Population Overview: by region AFN in Transition, 2000-2010
Where we are … 2000 Population Overview: by region AFN in Transition, 2000-2010
Where we are … 2000 Population Overview: by region AFN in Transition, 2000-2010
Where we are … 2000 Population Overview: by age AFN in Transition, 2000-2010
Where we are … 2000 Population Overview: by age AFN in Transition, 2000-2010
Where we are … 2000 Population Overview: by age AFN in Transition, 2000-2010
Where we are … Alaska Natives Living Abroad AFN in Transition, 2000-2010
Where we are … Alaska Natives Living Abroad AFN in Transition, 2000-2010
Where we are … Alaska Natives Living Abroad AFN in Transition, 2000-2010
Where we are … Alaska Natives Living Abroad AFN in Transition, 2000-2010
Where we are … Alaska Natives Living Abroad AFN in Transition, 2000-2010
How we have changed … General trends since 1990: • State population growth has been greater among Alaska Natives relative to non-Natives • Regional growth rates varied, but by far the Southern region grew most rapidly – mainly due to out-migration from other regions and states • The cohort of Alaska Natives between ages 10 and 18 now comprise the largest share of the Alaskan Native population • The share of Alaska Natives aged 40-55 experienced the fastest growth since 1990 and comprise the second largest share of the population • Alaska Natives aged 70-74 and 85+ grew roughly at an annual rate of 6% AFN in Transition, 2000-2010
How we have changed … General trends since 1990: • Population distribution between males and females has remained relatively constant • Infant Mortality rates have declined but large regional differences persist among Alaska Natives and infant mortality rates remain double non-Native infant mortality • Alaska Natives are increasingly multi-ethnic • Changes in the 2000 census invalidate Alaska Native population growth statistics based on straightforward comparisons to the 1990 census; the choice of a bridging method will strongly influence the statistics used in determining Federal and State appropriations AFN in Transition, 2000-2010
How we have changed … Statewide Population Growth AFN in Transition, 2000-2010
How we have changed … Regional Population Growth AFN in Transition, 2000-2010
How we have changed … Population Change by Age: all ages AFN in Transition, 2000-2010
Source: US Census, (2000 Native with one or more ethnicities); ISER How we have changed … Population Change by Age: all ages and gender AFN in Transition, 2000-2010
Source: US Census, (2000 Native with one or more ethnicities); ISER How we have changed … Population Change by Age: all ages and gender AFN in Transition, 2000-2010
How we have changed … Population Change by Age: 5 year cohorts AFN in Transition, 2000-2010
How we have changed … Population Change by Age: young, old, and elders AFN in Transition, 2000-2010
How we have changed … Changes in Mortality and Fertility: Infant Mortality AFN in Transition, 2000-2010
How we have changed … Changes in Mortality and Fertility: Infant Mortality AFN in Transition, 2000-2010
How we have changed … Changes in Mortality and Fertility: Infant Mortality AFN in Transition, 2000-2010
How we have changed … Changes in Mortality and Fertility: Infant Mortality AFN in Transition, 2000-2010
How we have changed … Changes in Mortality and Fertility: Life Expectancy AFN in Transition, 2000-2010
How we have changed … Changes in Mortality and Fertility: General Fertility Rate AFN in Transition, 2000-2010
How we have changed … Migration AFN in Transition, 2000-2010
How we have changed … Migration AFN in Transition, 2000-2010
How we have changed … Migration AFN in Transition, 2000-2010
Where we will be … What can we expect in 2010 and beyond: • A large increase in the share of 19-29 year olds – these changes will likely lead to: • Large wave of new entrants into the labor force • New “baby boom” • Less of a demand for elementary education between 2000-2010, but growing demand after 2010 • Greater demand for higher education • A large increase in 40-60 year olds - this change implies: • Large Alaska Native labor force – without adequate labor demand in rural areas out-migration and unemployment can be expected to increase • Growth of Alaska Native retirees after 2010 • An increasing share of multi-ethnic Alaskan Natives AFN in Transition, 2000-2010
Where we will be … AFN in Transition, 2000-2010
Where we will be … AFN in Transition, 2000-2010
Where we will be … AFN in Transition, 2000-2010
Where we will be … AFN in Transition, 2000-2010
Where we will be … AFN in Transition, 2000-2010
Where we will be … AFN in Transition, 2000-2010