Monitoring WUGS Switch
The newGBNSC is a Java-based GUI tool developed for monitoring network switches. It facilitates the real-time collection and presentation of switching metrics, including discard rates and bandwidths, graphed in Mb/s. Users can set monitoring periods, add/remove switches, and visualize multiple parameters on a single graph. The application interfaces seamlessly with external processes and offers functionality for saving and loading graph data configurations. System requirements include Java 1.2.x and compatibility with the switches under observation.

Monitoring WUGS Switch
E N D
Presentation Transcript
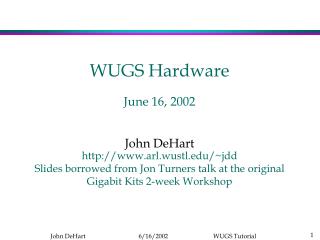
Monitoring WUGS Switch Jyoti Parwatikar January 7, 2002
CP newGBNSC WUGS Outline JAVAGUI • newGBNSC • JAVA GUI Network
newGBNSC • Function • Sends (receives) commands cells to(from) WUGS • Communicates w/ external processes (Jammer, JAVA Gui) • provides interface to send command cells & receive returned data • provides periodic operations
Running newGBNSC • Location: executable: wu_arl/wugs/bin source: wu_arl/wugs/src/newGBNSC README: wu_arl/wugs/src/newGBNSC/README • 2 executables • newGBNSC.init: reads & writes registers and vxtable • newGBNSC: read-only
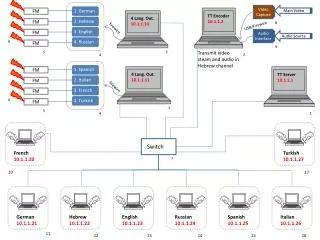
JavaGUI • Function: monitors live switch discard rates & bandwidths • graphs parameters in units of Mb/s • several switches may be monitored on one graph • period of monitoring is set by user with rates up to ~1/30000ms • interfaces with newGBNSC
Running JavaGUI • Requirements • Java 1.2.x runtime environment • newGBNSC or newGBNSC.init running on switches to be monitored • Location wu_arl/msr/apps/javaGUI/pubgui.jar README file in wu_arl/msr/apps/javaGUI/ • Starting • Windows : double click on pubgui.jar icon • Unix: java -jar pubgui.jar
Main Window Options Menu - start new graph, save/load graphs to/from file Monitor Switch Menu • list of switches • option to add new switches Graphical Components Popup Menus • Selecting item • hold down mouse button • drag across menu until item selected, • release button over item
Graph Options Menu - add/remove parameters, save graphs to file, show values Zoom Menu - zoom in/out Legend • Parameter names - editable text fields • Changing Names - select field, type & press enter • Showing hidden plot lines - move cursor over parameter name Scrollbar - scrolls along x-axis Note:only keeps track of last 400 values
Switch Graphic Switch Clock Rate in MHz value calculated and returned when the first parameter from this switch is added to a graph Port Buttons - press to see monitorable parameters Port Parameter Menu
IPP Parameters Bandwidth - IPP Maintenance Register FIELD NUMBER 4: Statistics-A BW with Recycled • Receive Cell Counter + Recycling Cell Counter BW with Recycled • Transmit Cell Counter Cell Discards - IPP Maintenance Register FIELD NUMBER 5: Statistics-B VXTCS0 Discard • VXT CS0 Overflow Counter Note: FIELD Number 4: Statistics-B RCB CLP0 Discard • RCB CLP0 Overflow Counter RCB CLP1 Discard • RCB CLP1 Overflow Counter CYCB Discard • CYCB Discard Counter Bad HEC Discard • Bad HEC Counter Total Discard • Sum of the above parameters
OPP Parameters Bandwidth - OPP Maintenance Register FIELD NUMBER 15: Statistics-A BW with Recycled • Transmit Cell Counter + Recycling Cell Counter BW with Recycled • Transmit Cell Counter Cell Discards - OPP Maintenance Register FIELD NUMBER 16: Statistics-B XMBCS0 Discard • XMB CS0 Overflow Counter XMBCS1 Discard • XMB CS1 Overflow Counter TOOLATE Discard • Too Late Discard Counter RESEQUENCER Discard • Resequencer Overflow Counter Total Discard • Sum of the above parameters
Converting Parameters • Parameters are displayed in Mb/s • Cell Counts are converted to Mb • Count differences are computed for each polling period and divided by the period length
Starting A New Graph Select Start New Graph from Options Menu Type Graph Name in text box Press Enter
Adding Parameter to Graph Select Add Parameter from Graph’s Options Menu Select Switch from Monitor Switch Menu Select Parameter to monitor from Switch Graphic Type Period of updates in Polling Rate Window Polling Rate Window
Removing Parameter From Graph Select Remove Parameter from Graph’s Options Menu Select parameter to remove from sub menu Showing Values Select Show Values from Graph’s Options Menu Select a point by placing the cursor over the graph and double clicking the mouse button (x,y) value of point appears in lower left corner of graph
Zoom Zoom In • Select Zoom In From Selection from Graph’s Zoom Menu • Draw rectangle around area to zoom while pressing mouse button • Release mouse button • Click inside rectangle to Zoom • To cancel click outside of rectangle Zoom Out • Select Zoom Out from Graph’s Zoom Menu
Add New Switch Select Add Switch from Monitor Switch Menu Fill in fields of text window & Press Enter Switch added to list stored in file userHomeDir/switches.txt Switch ID (arbitrary number for now) Name of host running newGBNSC for switch TCP port number of newGBNSC
Saving/Loading Files • A shortcut for saving a set of graphs frequently used • Files contain parameter and graph specifications • Loading a file automatically • starts a set of saved graphs, • connects to the switches • and sends the commands to start monitoring the specified parameters
Saving/Loading Files Cont’d Saving to File • All displayed graphs • Select Save To File from main window’s Options menu • Single Graph • Select Save To File from graph’s Options menu • Type name of file in File Window File Window Loading From File • SelectLoad From File from main window’s Options menu • Select file from File Window