Download
1 / 24
280 likes | 457 Views
Multinomial Experiments Goodness of Fit Tests. We have just seen an example of comparing two proportions. For that analysis, we used the normal distribution as a sampling distribution.

E N D
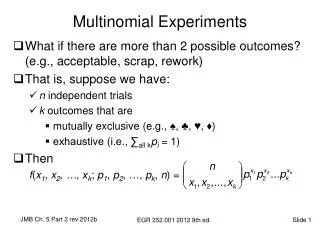
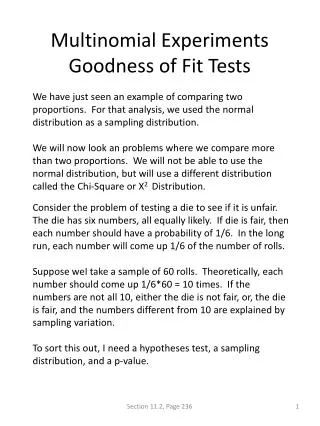
Multinomial ExperimentsGoodness of Fit Tests We have just seen an example of comparing two proportions. For that analysis, we used the normal distribution as a sampling distribution. We will now look an problems where we compare more than two proportions. We will not be able to use the normal distribution, but will use a different distribution called the Chi-Square or Χ2 Distribution. Consider the problem of testing a die to see if it is unfair. The die has six numbers, all equally likely. If die is fair, then each number should have a probability of 1/6. In the long run, each number will come up 1/6 of the number of rolls. Suppose weI take a sample of 60 rolls. Theoretically, each number should come up 1/6*60 = 10 times. If the numbers are not all 10, either the die is not fair, or, the die is fair, and the numbers different from 10 are explained by sampling variation. To sort this out, I need a hypotheses test, a sampling distribution, and a p-value. Section 11.2, Page 236
Goodness of Fit TestFair Die Example Following is the distribution of the observed frequencies of results from rolling a die 60 times. Is the die fair? The hypotheses are as follows: Clearly, the observed frequencies are not all equal to the theoretical frequencies of 10. We need a way to measure how big the “miss” is to see if it likely to be due to sampling variation, or if it is so large as to not be explained by sampling variation. Section 11.2, Page 239
Chi Square StatisticFair Die Example We calculate the “miss” called the chi-square statistic similarly to the way we calculate the variance. Note that the expected frequencies always equal the total number of observations × Ho true proportion for each cell or proportion. Also note that the total expected frequencies always equals the total observed frequencies. The χ2 Statistic is the Total, 2.2. Also, note that minimum value of the χ2 is zero. If we took another sample, we would likely get a different value for the chi-square statistic. Section 11.1, Page 239
Chi-Square DistributionFair Die Example Now we need a sampling distribution for the Χ2 statistic = 2.2, so we can calculate the probability of getting a Χ2 ≥ 2.2 when the true proportions are all equal to 1/6. Χ2 Distribution for 5 df This is a distribution of all possible Χ2 statistics calculated from all possible samples of 60 observations when there are 6 proportions or cells. Note that the degree of freedom equals the number of proportions – 1. Finding the p-value on the TI-83, Given Χ2 Stat, df PRGM – CHI2DIST LOWER BOUND: 2.2 UPPER BOUND: 2ND E99 df: 5 Output: P-VALUE = 0.8208The null hypothesis cannot be rejected. Section 11.2, Page 240
Chi-Square DistributionConditions The sample is random and the observed data represents counts of of individuals in individual categories of a categorical variable Each expected count is 5 or greater Section 11.1, Page 241
Goodness of Fit TestFair Die Example – TI-83 Add-In Following is the distribution of the observed frequencies of results from rolling a die 60 times. Is the die fair? The hypotheses are as follows: Each expected cell = 1/6*60 = 10. STAT-EDIT – LI: Enter the observed frequency numbers L2: Enter the expected values, 10 in each of 6 cells. PRGM – GOODFIT OBSERVED LIST = 2ND L1 EXPECTED LIST = 2ND L2 Answer: p-value = .8208, Chi-Square Stat = 2.2 Since p-value > 0.05, Ho cannot be rejected. Section 11.2, Page 240
Goodness of Fit TestMendelian Theory Problem Mendel’s genetic theory of inheritance claims that the frequencies of round and yellow, wrinkled and yellow, round and green, and wrinkled and green peas will occur in the ratio of 9:3:3:1. In testing the theory, Mendel obtained frequencies of 315, 101, 108, and 32 respectively. Does the data contradict the theory. Do a hypotheses test. Ho: The data fits the theory Ha: The data does not fit the theory. Calculation of Expected Values Section 11.2, Page 245
Goodness of Fit TestMendelian Theory Problem STAT – EDIT: Enter observed data in L1 and expected in L2 PRGM – GOODFIT OBSERVED LIST = 2ND L1 EXPECTED LIST = 2ND L2 Answer: p-value = .9254, Chi-Square Stat = .47 The null hypothesis cannot be rejected. The observed data does not contradict the theory Section 11.2, Page 243
Problems • Perform a hypotheses test to see if the colors are not equally likely. State the hypotheses. • Find the p-value and state your conclusion • What is the name of the model used for the sampling distribution? • What conditions must be satisfied? Are they? Problems, Page 252
Problems • Perform a hypotheses test to see if the preferences are not all the same. State the hypotheses. • Find the p-value and state your conclusion • What is the name of the model used for the sampling distribution? • What conditions must be satisfied? Are they? Problems, Page 252
Problems • Perform a hypotheses test to see of the observed data is inconsistent with the stated ratios. State the appropriate hypotheses. • Find the expected counts for each color. • What are the necessary conditions for the sampling distribution? • What is the name of the model used for the sampling distribution? • Find the p-value and state your conclusion. Problems, Page 252
Test for Independence Following is a two way table. In this case, two categorical variables are measured on one group of college students. For each student, their Gender and Favorite Subject Area are recorded. Independence of Two Variables Consider the Social Science category. 113/300 or 38% of all students chose Social Science. However, 41/122 or 34% of males chose the category and 72/178 or 40% of Females chose the category. Considering this a probability distribution, if I pick a person at random, there is a 38% chance the person chose Social Science. However, it you tell me the person is a female, then the probability is 40% they chose the category. This is an indication that the two variables are not independent, but related. Two variables are independent, if knowing the outcome of one variable does not change the probability of the outcome of the other variable. Section 11.3, Page 244
Tests for Independence The sample data gives an indication the variables are not independent, but this indication may be due to sampling variation. To test for independence, we will use Chi-Square methods. The appropriate hypotheses are: Ho: The variables are independent Ha: The variables are not independent Next, we need to calculate the expected values for each cell of the data matrix under the assumption that the variables are independent. For example, if the variables are independent, then the the overall proportion of of students in the Social science category is 113/300 = .3767. Both the proportions for the category have to be the same. The expected value for Males is 0.3767*122= 45.95 and the expected values for Females is 0.3767*178 = 67.05. Section 11.3, Page 244
Test for Independence Shown above in the parentheses are all the expected values. Next we need to calculate the χ2 statistic for each data cell. For example, for the first cell: (Observed-Expected)2/Expected = (37-29.28)2/29.28 = 2.0355. Adding up the cell calculations for the 6 cells gives total χ2 statistic of 4.604. The formula for df =(#rows – 1)*(#columns – 1) = (2-1)*(3-1) = 2. The area under the curve to the right of 4.604 = .1001 > .05. The null hypotheses cannot be rejected. Section 11.3, Page 246
Test for IndependenceBlack Box Program Ho: The variables are independent Ha: The variables are not independent 2nd MATRIX – EDIT 2 ENTER 3 (The data table is 2 rows and 3 columns. Ignore total row and total column) Enter the data in matrix [A] left to right STAT-TESTS-C:χ2-TEST Observed: [A] Expected: [B] Calculate Answer: p-value = .0999, χ2-Stat = 4.6063 2nd MATRIX – EDIT – [B] – ENTER Displays the Expected Values MatrixAll cells ≥ 5; conditions satisfied Section 11.3, Page 246
Problems Test the hypotheses that the size of community reared in is independent of the size of community residing in. State the appropriate hypotheses. Find the p-value and state your conclusion What is the name of the sampling distribution? What are the necessary conditions, and are they satisfied? What is the value of the smallest expected cell? Section 11.3, Page 254
Problems Test the hypotheses that years of employment and knowing what supervisor expects are independent. State the appropriate hypotheses. Find the p-value and state your conclusion What is the name of the sampling distribution? What are the necessary conditions, and are they satisfied? What is the value of the smallest expected cell? Section 11.3, Page 254
Problems Test the hypotheses that the survival rate and the treatment are independent. State the appropriate hypotheses. Find the p-value and state your conclusion What is the name of the sampling distribution? What are the necessary conditions, and are they satisfied? What is the value of the smallest expected cell? Problems, Page 253
Tests for Homogeneity Another application of Chi-Square procedures is test for homogeneity, or essentially, a test whether different groups have the same distribution for a given variable. Consider the table below that gives voter’s opinion on a proposal broken down by separate locations. In the case of a test for independence, we had one group of individuals and measure two categorical variables in that group. In the case of a test for homogeneity, we have one categorical variable, Opinion on Proposal, and three separately located groups of voters. The hypothesis are: Ho: The distributions are homogeneous Ha: The distributions are not homogeneous Section 11.3, Page 247
Tests for Homogeneity The mechanics for a test of homogeneity are exactly the same as for a test of independence. We calculate the expected values under the assumption Ho is true. The proportion favor are all assumed to be 254/500 = .5080. The expected value for urban is .5080*200 = 101.6. The χ2 Stat for cell 1 = (143-101.6)2/101.6 = 16.8897. The total χ2 statistic for all cells is 91.72. The df = 2 and the p-value = 1.21E-20 ≅ 0 Ho is rejected, the distributions are not the same. Section 11.3, Page 248
Problems • State the hypotheses. • Find the p-value and state your conclusion. • What is the name of the model used for the sampling distribution. • What is the value of the smallest expected cell? Section 11.3, Page 253
Problems • State the hypotheses. • Find the p-value and state your conclusion. • What is the name of the model used for the sampling distribution. • What is the value of the smallest expected cell? Section 11.3, Page 253
Summary of Chi-Square Applications Goodness of Fit Test Given one categorical variable with a fixed set of proportions for the categories. Ha: The observed data does not fit the proportions. Calculate expected values (Ho true proportion * total observations) Observed and Expected data in List Editor PRGM: GOODFIT Test for Independence Given two categorical variables measured on the same population. Ha: The variables are not independent (They are related) Observed data in Matrix Editor Stat-Tests-χ2 Test Test for Homogeneity Given one categorical variable and two or more populations.Ha: The proportions for the categories are not the same for for all populations.Observed data in Matrix Editor Stat-Tests-χ2 Test Chapter 12, Summary
Problems • Is this a goodness of fit test, a test for independence, or a test or homogeneity? • State the hypotheses. • Find the p-value and state your conclusion. • What is the name of the model used for the sampling distribution. • What is the value of the smallest expected cell? Problems, Page 252