Download
1 / 15
200 likes | 455 Views
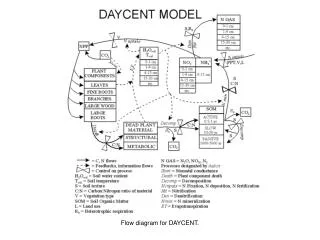
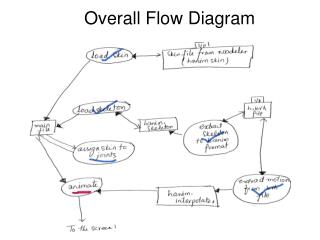
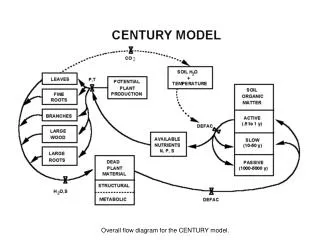
Overall flow diagram for the CENTURY model. Optional input files for Century 4.5 nscale.dat - The optional multipliers on N inputs contained in this file can be used to scale the amount of fertilizer added through FERT events, the amount of atmospheric N deposition, or both.

E N D
Optional input files for Century 4.5 nscale.dat - The optional multipliers on N inputs contained in this file can be used to scale the amount of fertilizer added through FERT events, the amount of atmospheric N deposition, or both. omadscale.dat - The optional multiplier on OMAD inputs contained in this file can be used to scale the amount of organic matter added through OMAD events. phscale.dat - The optional multipliers that can be used to scale pH. tmaxscale.dat - The optional addends that can be used to scale maximum temperature values. tminscale.dat - The optional addends that can be used to scale minimum temperature values. precscale.dat - The optional multiplier that can be used to scale precipitation values. All of these files are organized in 13 columns. Column 1 is the simulation year. Columns 2 - 13 contain the scalars.
Data requirements for running the Century model • Type of system (grass, crop, savanna, forest) • Average monthly precipitation (cm) • Average monthly minimum temperature (degrees C) • Average monthly maximum temperatures (degrees C) • Site latitude and longitude (degrees) • Fraction sand, silt, and clay of the mineral soil, by layer (0.0-1.0) • Bulk density of the soil, by layer (g/cm^3) • Rooting depth and root distribution of the vegetation (in cm) • Best estimate of annual wet and dry N deposition • Productivity of vegetation (gC/m^2 per year or growing season) • C:N ratio of above- and belowground vegetation (split into leaves, branches, large wood, fine roots, and coarse roots for trees) • Root to shoot ratio of vegetation (or % allocation of production to leaves, branches, large wood, fine roots, and coarse roots for trees) • Lignin content of vegetation (above- and belowground for grasses; split into leaves, branches, large wood, fine roots, and coarse roots for trees)
Additional data requirements for running the Century model • C in the soil organic matter in the top 20cm of soil • N in the soil organic matter in the top 20cm of soil • Do you want to include fire in your simulation of the system? • Is the system tilled? • Is fertilizer added (how many gN/m^2) • Do you want to simulate grazing? • What type of harvest is conducted? • How many cm of water are added through irrigation? • How much and what type of organic amendment is added (manure, fish meal, green manure)? • Is your system flooded at any point during the year?
Block scheduling notes • A block is a series of events which will repeat themselves, in sequence, until the ending time of the block is reached. • One year repeating sequence, e.g. continuous corn, scheduled to occur from years 1971-1990 • Year 1971, grow corn • Year 1972, grow corn • … • Year 1990, grow corn • Two year repeating sequence, e.g. wheat/fallow, scheduled to occur from years 1965-2000 • Year 1965, grow wheat • Year 1966, fallow • Year 1967, grow wheat • Year 1968, fallow • … • Year 1999, grow wheat • Year 2000, fallow
Block scheduling notes, con’t • Five year repeating sequence, e.g. tall grass prairie with burn every 5 years, scheduled to occur from years 1971-2003 • Years 1971, 1972, 1973, 1974, grow grass • Year 1975, burn scheduled • Years 1976, 1977, 1978, 1979, grow grass • Year 1980, burn scheduled • ... • Years 1996, 1997, 1998, 1999, grow grass • Year 2000, burn scheduled • Years 2001, 2003, 2003 , grow grass • Note that when a block ends prior to the end of the repeating sequence the events that were scheduled to occur in the years that fall outside the period in which the block was scheduled will not be simulated.
Block scheduling notes, con’t • 100 year repeating sequence, e.g. forest with burn every 100 years, scheduled to occur from years 1-1990 • This “could” be scheduled as a 100 year repeating block but it is easier to created two blocks: • Block 1, one year repeating sequence of tree growth, scheduled to occur over 99 years • Block 2, one year repeating sequence of forest fire, scheduled to occur over 1 year • Create the schedule file by alternating the use of these two blocks: • Years 1-99, Block 1 • Year 100, Block 2 • Years 101-199, Block 1 renumbered as Block 3 • Year 200, Block 2 renumbered as Block 4 • … • Years 1800-1899, Block 1 renumbered as Block 25 • Year 1900, Block 2 renumbered as Block 26 • Years 1901-1990, Block 1 renumbered as Block 27
Command lines • Century command line: century –s c3grs -n c3grs The schedule file is named c3grs.sch and the binary output file created will be named c3grs.bin. • event100 command line when modifying an existing schedule file event100 –i c3grs The c3grs.sch file will be opened and read into the grid. You can edit this schedule file as desired.
Output file notes Note that the output time values in the *.bin files are computed by adding the fraction of the year (month/12) to the simulation year such that: Year Month Calculation *.bin file ---- ---------- ----------- ---------- 1900 Jan = 0.08 1900 + 0.08 1900.08 1900 Feb = 0.17 1900 + 0.17 1900.17 1900 Mar = 0.25 1900 + 0.25 1900.25 1900 Apr = 0.33 1900 + 0.33 1900.33 1900 May = 0.42 1900 + 0.42 1900.42 1900 Jun = 0.50 1900 + 0.50 1900.50 1900 Jul = 0.58 1900 + 0.58 1900.58 1900 Aug = 0.67 1900 + 0.67 1900.67 1900 Sep = 0.75 1900 + 0.75 1900.75 1900 Oct = 0.83 1900 + 0.83 1900.83 1900 Nov = 0.92 1900 + 0.92 1900.92 1900 Dec = 1.00 1900 + 1.00 1901.00 1901 Jan = 0.08 1901 + 0.08 1901.08 etc.
Notes on Production output variables The new growing season production variables, AGCPRD, BGCPRD, CRTPRD, EUPPRD(*), FBRPRD, FCPRD, FRTPRD, RLVPRD, and RLWPRD, are set equal to the value of their associated accumulator variable when a LAST or TLST occurs. These values can be used when examining yearly output to see the amount of production that occurred over the previously completed growing season. These growing season production variables will be set back to zero in January if no production has occurred over the previous 12 month period.
Gotcha’s • Incorrect units in climate file • Weather statistics in <site>.100 file do not match the weather data file being used • Too much/too little atmospheric N deposition • Cultivation event scheduled to occur prior to harvest event • Neglecting to modify parameter values as necessary for Century 4.0 input files used for a Century 4.5 run
Analyzing model output • Check NPP for site. Reasons NPP may be too high or too low: • Need adjustment to PRDX variable in CROP.100 and/or TREE.100. • The temperature function used in the growth equations may be parameterized incorrectly, i.e., trying to grow a C3 grass using a C4 temperature curve. Check the PPDF(*) parameters in the CROP.100 and/or TREE.100 file. • N deposition rates are too high or too low. Check WDFX output variable. • Once the NPP seems reasonable for the site go on to check other output values.
Help me! • Century4.5.Instructions.txt • Century 4 web site: http://www.nrel.colostate.edu/projects/century • Century User’s Manual • Century Tutorial • Century Parameterization Workbook • Century Curves Excel Spreadsheet • Tricks of the trade: • DOS batch files • Excel “templates” • century@nrel.colostate.edu