Download

1 / 12
120 likes | 262 Views
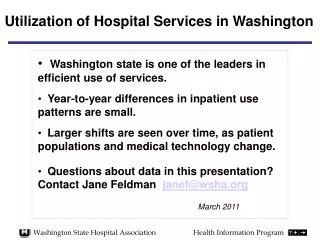
Hospital Services Are Changing. Washington state is one of the leaders in efficient use of services. Year-to-year differences in inpatient use patterns are small. Larger shifts are seen over time, as patient populations and medical technology change.

E N D
Hospital Services Are Changing • Washington state is one of the leaders in efficient use of services. • Year-to-year differences in inpatient use patterns are small. • Larger shifts are seen over time, as patient populations and medical technology change. • Questions about data in this presentation? Contact Ken Rudberg(kenr@wsha.org). • Updated February 2012 Washington State Hospital Association
One-quarter of inpatient cases are deliveries and newborns • Moms and babies are each counted as an inpatient stay. • Over the last five years, the distribution of services has remained relatively constant. Inpatient Stays by Service Lines Data Source: WSHA-Enhanced CHARS Inpatient file, CY2010 Washington State Hospital Association
Including newborns, about 1 in 5 inpatients are children under age 18 All Stays by Patient Age Non-Maternity Stays by Age Data Source: WSHA-Enhanced CHARS Inpatient file, CY2010 Washington State Hospital Association
Ten non-maternity diagnoses (DRGs) account for 15 percent of all inpatient stays Percent of All Stays DRG 470 Major joint replacement 3.4% 885 Psychoses 2.1% 392 Selected gastroenterological 1.8% disorders 871 Septicemia or severe sepsis 1.6% 603 Cellulitis 1.3% 743 Selected uterine procedures 1.3% 194 Simple pneumonia & pleurisy 1.1% 690 Kidney & urinary tract infections 1.0% 945 Rehabilitation 1.0% 313 Chest pain 0.9% See slide notes. Data Source: WSHA-Enhanced CHARS Inpatient file, CY2010 Washington State Hospital Association
Over half of all hospital stays are insured by government programs Medicare, for the elderly, and Medicaid, for low-income patients, are major sources of hospital coverage. Inpatient Stays by Payer Data Source: WSHA-Enhanced CHARS Inpatient file, CY2010 Washington State Hospital Association
Medicaid is a major insurer of children and young adults • Patients are classified based on their primary insurer. • The percent of patients under 65 with Medicare as their primary insurer has increased 22 percent from 2005 to 2010. Hospital Insurer by Patient Age Data Source: WSHA-Enhanced CHARS Inpatient file, CY2010 Washington State Hospital Association
Two out of five inpatients are admitted from the emergency room • Most admits from the emergency room are covered by Medicare or private insurers (78%). • Over half of admissions with private insurance are from physician referrals (54%). Admission Source by Payer Inpatient Admits 41% 37% 22% Data Source: WSHA-Enhanced CHARS Inpatient file, CY2009 Washington State Hospital Association
Four out of five patients are discharged to their homes • 19 percent of discharged patients receive long-term care, home health services, or care at another hospital. Discharge Outcomes Data Source: WSHA-Enhanced CHARS Inpatient file, CY2010 Washington State Hospital Association
Inpatient volume increased 6 percent since 2005, but had a small decrease in 2010 • In 2010, total admissions fell by 0.2 percent over the prior year, with 992 fewer admissions. • Newborn admissions decreased by 3.7 percent from 2009 to 2010. Inpatient Discharges, including Births Data Source: WSHA-Enhanced CHARS Inpatient files Washington State Hospital Association
Hospital-based outpatient visits continued to decline in 2010 • Outpatient visits have increased 13.7 percent overall since 2005. • The past two years have seen a decline in outpatient visits, with a decrease of 2.2% from 2008 to 2010. Outpatient Visits Data Source: DATABANK Quarterly Hospital Financial Reporting system Washington State Hospital Association
Inpatient and outpatient use rates have decreased in the past year by population • Inpatient visits increased minimally by 589 visits since 2008 (0.09%), whereas outpatient visits decreased by 45,125 (-0.38%). • More outpatient care may be occurring in facilities that are not hospital-based. Visits per 1,000 population Outpatient visits per 1000 population Inpatient visits per 1000 population See slide notes. Data Sources: DATABANK Quarterly Hospital Financial Reporting system, WSHA-Enhanced CHARS Inpatient files, Washington State Office of Financial Management Washington State Hospital Association
Hospital-based primary care visits declined in 2009 per population • Per capita emergency room visits increased by 7.6 percent since 2005. • From its peak in 2002, outpatient surgeries per population have decreased 14 percent. Outpatient Visits per 1,000 population Primary Care Visits ER Visits Outpatient Surgeries Data Sources: DATABANK Quarterly Hospital Financial Reporting system, Washington State Office of Financial Management Washington State Hospital Association