Download
1 / 34
350 likes | 512 Views
Optical Characterization of Liquid Crystal Switchable Mirror. Philippe Lemarchand School of Physics You Supervisors’ Names Here Prof. Brian Norton Dr. John Doran 15 February 2013. Project Background Concentration of Solar Energy Using Switchable Mirrors. What are Switchable Mirrors?

E N D
Optical Characterization of Liquid Crystal Switchable Mirror Philippe Lemarchand School of Physics You Supervisors’ Names Here Prof. Brian Norton Dr. John Doran 15 February 2013
Project BackgroundConcentration of Solar Energy Using Switchable Mirrors. • What are Switchable Mirrors? Optical element that can be switched between a Transparent state and a Reflective state.
Project BackgroundConcentration of Solar Energy Using Switchable Mirrors. Example 3: Tubular Concentrator Example 2: Inward Facing CPC Example 1: Flat absorber with booster mirror Linear Fresnel Mirror Configuration • Why for Solar Concentration? • optically track the sun Remove need for mechanical parts and costs associated • collect a wide proportion of the solar diffused component More light collected than standard stationary concentrators • optically regulate the solar heat flow Reduce the need for cooling and cost associated • optically concentrate and transfer the reflected energy onto a photovoltaic (PV), thermal (T) or PV/T absorber Reduce area of expensive absorber and cost associated • How? choice of material, weather conditions and concentrator design.
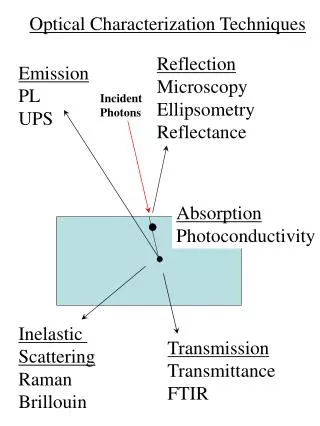
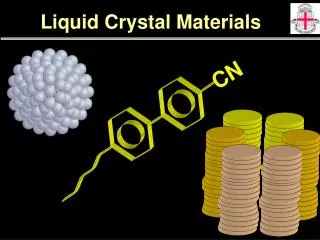
Dynamic Optical Behaviour of LC Switchable MirrorConcentration of Solar Energy Using Switchable Mirrors.Experiment on a Visible [400-700nm] Switchable Mirror (5x5cm) Glass substrate, np=1.52 ITO layer, np=1.89 Polyimide coating, np=1.90 CLC polymer (diacrylate+monoacrylate), nacrylate=1.49 Rmol T LC molecule Example: 5CB (4-pentyl=4'-cyanobiphenyl) n0=1.54, ne=1.71 Dn=0.18 Rair-g Mol. Reflection Central Wavelength: 1 Mol. Reflection Bandwidth: 2.5mm 2.5mm 20 mm Mirror Reflection Bandwidth: square wave 0-~250V at 25Hz <10mA Average Power consumption: 40 mW/cm2 • Transmission and Reflection bandwidth with light incidence angle. • Percentage Transmission and Reflection in the Clear and Reflective states with light incidence angle • Switching Speed from Clear to Mirror and from Mirror to Clear states.
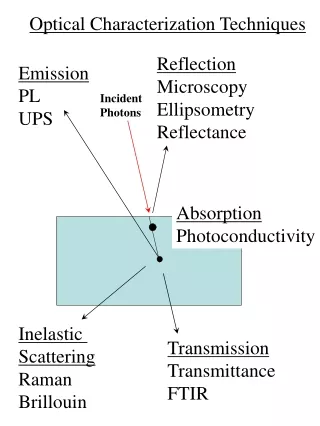
Setups Lambda900 spectrophotometer Measure spectral Transmission UV to NIR. Normal light incidence angle with mirror Clear and Reflective at Sample port and Integrating Sphere port. Scanning time of visible range: ~1min At T=10% accuracy of ± 0.08% At T=35% accuracy of ± 0.05% Results used as a reference for comparison with the second setup. Spectrophotometer with Angular Resolution Switchable Mirror Rotational Stage: Varies light incidence angle on mirror. Detector Rotational Stage: Rotate independently of ‘mirror stage’ collecting all light reflected by or transmitted through the mirror. Spectrometer A: Detector for spectral reflection and transmission. Spectrometer B: Detector for source fluctuation detection Angular accuracy: 1 degree Scanning time of visible range: millisecond Transmission/Reflection accuracy unknown at this stage Using lambda900 results as reference
Results by Lambda900 380-780nm Global Sun Power: 549 W.m-2 Direct Sun Power: 479 W.m-2 780-1350nm Global Sun Power: 324 W.m-2 Direct Sun Power: 305 W.m-2
Results by Lambda900 • In Clear State: • UV cut off (@T≤50%): 383nm • T≥80% from 419nm • In Reflective State: • <330nm UV transmission <1% • NIR cut off (@T≥50%): 732nm • Light leakage ≤5% in the range 423nm-681nm • In Clear and reflective state: • >75% transparent at wavelengths >800nm
Results by Lambda900 Absolute Transmission Dynamic between Clear and Reflective States. • In Clear State: • UV cut off (@T≤50%): 383nm • T≥80% from 419nm • In Reflective State: • <330nm UV transmission <1% • NIR cut off (@T≥50%): 732nm • Light leakage ≤5% in the range 423nm-681nm • In Clear and reflective state: • >75% transparent at wavelengths >800nm • Additional Information: • - Transmission modulate by 80% between Clear and Reflective state in [434-685nm]
Results by Lambda900 Relative Transmission Dynamic between Clear and Reflective States. • In Clear State: • UV cut off (@T≤50%): 383nm • T≥80% from 419nm] • In Reflective State: • <330nm UV transmission <1% • NIR cut off (@T≥50%): 732nm • Light leakage ≤5% in the range 423nm-681nm • In Clear and reflective state: • >75% transparent at wavelengths >800nm • Additional Information: • Transmission modulate by 80% between Clear and Reflective state in [434-685nm] • High reflective efficiency of the mirror [419nm-708nm] • Reflection bandwidth 400-780nm
Spectrometer with Angular ResolutionMethod to Measure Absolute Reflection and Transmission <A> +sA <B> +sB Asource Bsource <A> <B> Step 1: Without mirror, measure the fluctuation of the source over several minutes Since both spectrometers are looking to the fluctuation in intensity by the same source, to a percentage of source fluctuation detected by spectro B corresponds a percentage of fluctuation detected by spectro A by a factor ‘f’. ) Step 2: During Transmission and Reflection measurements with spectro A, measure the source fluctuation with spectro B and calculate what would have been the source spectrum recorded by spectro A. =*
Spectrometer with Angular ResolutionMethod to Measure Absolute Reflection and Transmission Useful Spectral Range of the setup: 380-795nm Correction factor varying between 0.97 and 1
Spectrometer with Angular ResolutionComparison Method with Lambda900
Results by Spectrophotometer with Angular ResolutionMirror Reflective – Reflection Measurement Increasing Incidence Angle Induces: Reflection spectrum shrinks towards blue wavelength (Red light is lost and blue light is increasingly reflected) Reflection bandwidth decreases Average reflection percentage decreases !Reflection varies within 380-780nm range! !Reflection >70% at Normal incidence within 420-700nm!
Mirror Reflective – Transmission measurement Increasing Incidence Angle Induces: Increased transmission of red wavelengths and decrease of blue wavelengths Transmitted wavelength plateau at 80% transmission Average transmission increases
Mirror Clear – Reflection Measurement Uniform spectral reflection Reflection increases with angle solely due to glass reflection
Mirror Clear – Transmission Measurement Quasi uniform spectral transmission Transmission decreases due to increased reflection by glass Note: An optical coating could be applied to maintain transmission to its maximum… …but reflection in the reflective state would also be decreased
Mirror Clear – Summary within [380-780nm] Perfect Match between Lambda900 and Spectrophotometer experiments; T=84% at Normal incidence Transmission • Transmission constant (84%) up to glass critical angle (41deg) • Transmission decrease follows glass transmission trend. • Reflection constant (9%) up to glass critical angle. • Molecules are adding an extra 5-6% reflection compared to glass. • Constant optical loss (7%) is believed to be mostly due to diffusion ; not absorption Reflection Abs./Diff.
Mirror Reflective – Summary within [380-780nm] • Reflection decreases from 69% to 46% between 0° and 62° • Transmission increases from 16,5% to 40% between 0° and 62° • Optical losses constant to 14.4%. Molecules in planar alignment add 9-10% loss. • !Mirror maintains its optimum performances within 12 degrees incidence angle! Reflection Perfect Match between Lambda900 and Spectrophotometer experiments; T=16,5% at Normal incidence Transmission Abs./Diff.
Switching Time – from Clear to Mirror State1 spectrum recorded every 30 secs for 1 hour. Mirror switched to reflective state in <30secs within [430-680nm]
Switching Time – from Clear to Mirror State Switch from Clear to Mirror; Meas. In Reflection at 11deg; Time between spectra:30ms Mirror fully switched to reflective state in 10-20 secs within [430-680nm]
Results by Spectrophotometer with Angular Resolution Switch from Mirror to Clear; Meas. In Transmission at 0deg; Time between spectra:30ms Mirror fully switched to Clear state in <200ms within [380-780nm]
LC Switchable MirrorSolar Transmissionand Reflection Consideration: Powering a 1m2switchable mirror consumes as much as the solar power received! Including absorption loss by solar absorber and power conversion losses -> Results in power deficit! Reflection bandwidth at normal incidence: 400-780nm Reflection bandwidth for R>70% at normal incidence: 420-700nm Spectral range with transmission and reflection fluctuation within 62degrees: 380-780nm Power consumption (clear state): ~400W.m-2 Spectral Range considered: 380-780nm Direct Solar Input power: 479W.m-2 *Values constant within 12 degree light incidence angle. Solution to consider: • Improve the material conductivity • Adapt driver duty cycle and voltage for reduce power consumption and maintain transmission. • Apply optical coating for optimum transmission (best case scenario: gain 77 W.m-2) • The area of the switchable mirror in the design has to be several time smaller than the solar area of collection • Use a mirror with widest transmission/reflection bandwidth possible: 380-1380nm
LC Switchable MirrorSolar Transmissionand Reflection A 1m2 mirror for 1m2 collection are would provide 258W.2 gain if power consumption remains identical for a switchable mirror of 1000nm bandwidth Power consumption of switchable mirror demands to be lowered for best results. Reflection bandwidth at normal incidence: 400-780nm Reflection bandwidth for R>70% at normal incidence: 420-700nm Spectral range with transmission and reflection fluctuation within 62degrees: 380-780nm Power consumption (clear state): ~400W.m-2 Spectral Range considered: 380-1380nm Direct Solar Input power: 784W.m-2 * Values constant within 12 degree light incidence angle.
Conclusions • The visible range CLC switchable mirror has been optically characterized. • Data can be integrated into ray tracing software for designing solar concentrators • Power consumption of mirror in the Clear state limits the area of switchable mirror that can be used. Design is critical. • Further technical investigations shall focus towards: • Power consumption • Optical performances of switchable mirror active in the 380-1380nm range. • Optical simulation of solar concentrator designs using switchable mirrors
Results by Lambda900 Mirror Clear at Integrating Sphere Square wave voltage applied High voltage: Molecules forced to align 0V: Molecules quickly relaxing in a partially reflective state Results: Noise during scanning Mirror Clear at Sample Port Mirror Clear at Sample Port Mirror Reflective at Sample Port
Mirror Reflective – Absorption/Diffusion within CLC layer High Diffusionof blue/Green wavelengths
Mirror Clear – Absorption/Diffusion within CLC layer Symmetrical diffusion in blue and red wavelengths. Effect of the film structure rather than only the material??
Mirror Clear – Absorption/Diffusion induced by molecules rotation Diffusion has a linear/proportional function with molecules angle?!
Average Photon Energy (APE) –Expression of spectral shift and intensity variation Reflective State Transmission Meas. Clear State: the mirror acts as a simple glazing; the APE deviation from the source is quasi constant (-12nm); Colour neutral. Reflective State: • In transmission: APE deviation varies between +55nm and +75nm; Colour variation from yellow to red • In reflection: APE deviation varies from -20nm to -68nm; Colour variation from neutral to white-blue Clear State Transmission Meas. Source APE REFERENCE Clear State Reflection Meas. Reflective State Reflection Meas.