Optical Characterization methods
Learn about Rayleigh scattering, Raman scattering, transmission of photons, photoluminescence, and more in-depth optical characterization methods with applications and setups.


Optical Characterization methods
E N D
Presentation Transcript
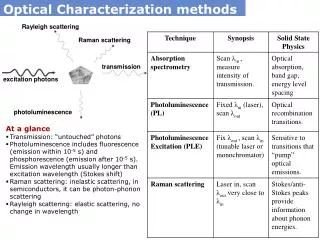
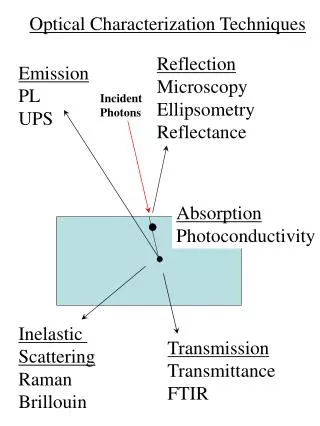
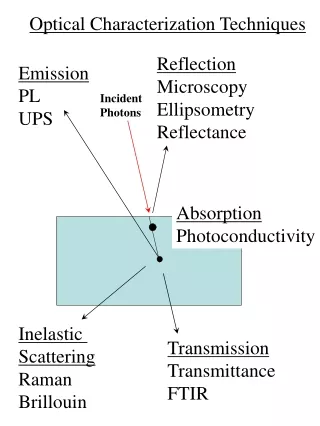
Optical Characterization methods Rayleigh scattering Raman scattering transmission excitation photons photoluminescence • At a glance • Transmission: “untouched” photons • Photoluminescence includes fluorescence (emission within 10-5 s) and phosphorescence (emission after 10-5 s). Emission wavelength usually longer than excitation wavelength (Stokes shift) • Raman scattering: inelastic scattering, in semiconductors, it can be photon-phonon scattering • Rayleigh scattering: elastic scattering, no change in wavelength
absorption emission bulk semiconductor Energy levels in molecules and semiconductors PL of bulk semiconductor usually have peak at band gap, while absorption and PLE is broad and can determine density of state. Molecular energy level • In molecules absorption and PLE peaks are couple of S1 and S2 with vibrational energy, while PL peaks are couple of S0 and vibrational energy.
Energy levels in quantum dots Left: The evolution of the UV-Vis and PL spectra of the core/shell nanocrystals upon the growth of the CdS shell in a typical reaction. Right: Asymmetric PL of core/shell nanocrystals with five monolayers of CdS shell. CdSe quantum dot PL and PLE peaks in CdSe quantum dots can be used to compute energy spacing and relaxation characteristics for electrons and holes
Absorption Spectrometry Measurement Principle • For single beam instrument, data is acquired twice, once with a reference cell, once with a sample cell in place. Signal ration is taken to give absorbance. • A double-beam instrument adjust zero with the shutter closed; when the shutter opens the absorbance is read directly from the difference amplifier. Application • Characterize optical absorption Advantage • Relatively simple instrument Disadvantage • Limited sensitivity especially when the change in absorption is small compared to transmission. (a) single-beam instrument, (b) double-beam instrument • Setup • Both setups have a filter or monochromator for wavelength selection, a transducer and a readout device for data collection. • Double-beam instrument splits the excitation source for faster acquisition and greater accuracy • Our UV-VIS system is a single beam instrument with a monochromator
Photoluminescence and PLE PL&PLE spectra for quinine solution PL PLE Measurement Principle • PL: excitation wavelength is fixed, emission intensity vs. wavelength is obtained by scanning a monochromator of spectrometer. • PLE: emission is detected at a fixed wavelength while excitation wavelength is scan (by a monochromator or tunable laser) to obtain emission intensity vs. excitation wavelength. Application • Provide both optical absorption and emission information Advantage • PLE is similar to absorption in some sense, with much better sensitivity. Detection limits can be three orders of magnitude smaller than those encountered in absorption spectroscopy. Diagram of a PL&PLE system • Setup • A combined PL and PLE system has 2 monochromators for wavelength selection of excitation and emission. A single PL system can have a laser as an excitation source. A tunable laser can also be used instead of the excitation monochromator. • A beam splitter and a reference detector is used to compensate for the variation in excitation intensity
Photoluminescence Setup: Princeton/ Acton entrance slit, f/4 xyz stage fiber optics, f/2.5 collimating mirror f = 127 mm f/2.4 focusing mirror CCD 1024x256 f = 63.5 mm f/1.2 SP-150 Spectrometer f = 150 mm; f/4 dual grating turrets cryostat Excitation laser