Download
1 / 21
210 likes | 368 Views
Assimilation of TES ozone into the GEOS-Chem and GFDL AM2 models: implications for chemistry-climate coupling. Mark Parrington, Dylan Jones University of Toronto. Kevin Bowman Jet Propulsion Laboratory California Institute of Technology. Larry Horowitz Geophysical Fluid Dynamics Laboratory.

E N D
Assimilation of TES ozone into the GEOS-Chem and GFDL AM2 models: implications for chemistry-climate coupling Mark Parrington, Dylan JonesUniversity of Toronto Kevin Bowman Jet Propulsion LaboratoryCalifornia Institute of Technology Larry Horowitz Geophysical Fluid Dynamics Laboratory Anne Thompson Pennsylvania State University
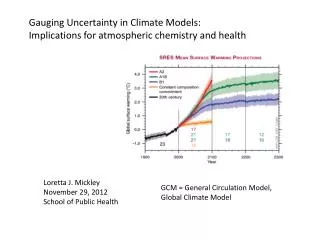
Role of ozone in chemistry-climate coupling Mickley et al,(2004), JGR Direct effect: Instantaneous radiative forcing from tropospheric ozone since preindustrial times of .49 W/m2 Change of .28o C increase in global annual mean surface temperature Indirect effects: Suppression of carbon uptake by ozone damage to plants could lead to additional 0.62 to 1.09 W/m2 CO2 radiative forcing Sitch et al,(2007), Nature
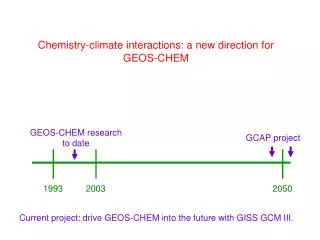
Observational constraints on climate prediction • How can predictions from global • chemistry-climate models (GCCM) be • constrained by current observations, e.g. TES? • One approach: • Investigate whether GCCM have the right • processes: • Assimilate observations into a GCCM • to reproduce current atmosphere. • Assimilated observations into a chemistry • and transport model (CTM). • Evaluate differences between CTM and GCCM. • We must first assess if TES ozone distributions can constrain GCCM and CTM estimates. 1860 2000 2100 L. Horowitz (2006), JGR
TES Global Survey Observations, August 1-31 2006 TES O3 at 500 hPa ppb • Enhanced O3 abundances from central Asia, across the Middle East, and over the subtropical Atlantic • High O3 over the southeastern USA
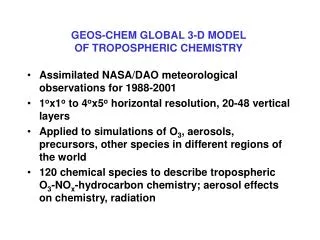
AM2-Chem GCM developed at NOAA GFDL 2.0° latitude x 2.5° longitude, 24 vertical levels (top level approx. 10 hPa) Chemistry scheme based on MOZART-2 [Horowitz et al., 2003; Tie et al., 2004] Stratospheric ozone distribution from HALOE climatology Model dynamics constrained by Newtonian nudging to NCEP reanalyses GEOS-Chem Chemical transport model 2.0° latitude x 2.5° longitude or 4° latitude x 5° longitude, 55 vertical levels (top level approx. 0.01 hPa) Model transport driven by GEOS-4 GMAO analyses Linoz parameterization of stratospheric ozone vertical distribution Tropospheric Models
Chemical Data Assimilation Methodology Sequential Sub-optimal Kalman filter Kalman Gain Matrix: Analysis Error Cov. Matrix: • Observation operator (H) accounts for TES averaging kernels and a priori profiles • Analysis error variance transported as a passive tracer Models and Data Streams • GEOS-Chem and AM2 models with full nonlinear tropospheric chemistry • O3 and CO profile retrievals from TES for July 1 through August 31 2006 • 6-hour analysis cycle • Assumed forecast error of 20% for CO and 50% for O3 • Neglected horizontal correlations in forecast and observation error covariance matrices • Results presented for 15 August 2006
Ozone analysis over North America ozone at 5 km, August 15, 2006
Impact of TES data over North America and globally GEOS-Chem ozone / ppbv GEOS-Chem ozone / ppbv Mean ozone bias between the models over N America is reduced from 7 to -1 ppbv following TES assimilation
Impact on vertical ozone distribution NOx O3, no assim O3, assim Discrepancies in lightning NOx emissions between the two models leads to differences in UT ozone distribution AM2-Chem GEOS-Chem Ozone cross-section at 40° N
Impact on vertical ozone distribution NOx O3, no assim O3, assim AM2-Chem Redistribution of ozone “tropopause” (110 ppbv contour) in AM2-Chem reflecting coarse vertical resolution and smoothing of TES retrievals GEOS-Chem Ozone cross-section at 40° N
Sonde No assim Assim Comparison to IONS ozone sondes AM2-Chem Marginal improvement in mid-tropospheric ozone variance following assimilation. Significant improvement in mid-tropospheric ozone distribution following assimilation. GEOS-Chem
Conclusions • The TES data have sufficient information to constrain modelled tropospheric ozone distributions • Bias between assimilated AM2 and GEOS-Chem < 1ppb. • Comparison to IONS ozone sondes in mid-troposphere • Less than 10% for AM2 • Less than 5% for GEOS-Chem • However, assimilated model fields provided marginal improvement in agreement with ozonesonde variability • ozonesonde variability driven by small spatio-temporal scale (“sub-grid”) processes not represented in model and not sufficiently sampled by TES data. • Discrepancies in lightning emissions of NOx between the two models leads to very different ozone distributions in the upper troposphere • “Normalized” radiative forcing (W/m2/ppb) could be overestimated due to lower ozone background. • Higher vertical resolution is required in both models and data to fully capture steep gradients in the vertical ozone distribution across the UTLS (assimilation of ozone profiles retrieved from limb sounder data such as MLS or HIRDLS will help to better constrain ozone over this region)
TES ozone profile retrieval characteristics Degrees of Freedom for Signal Pressure / hPa Latitude / degrees N Averaging kernel • The averaging kernel matrix gives the sensitivity of the retrieved profile to the true state of the atmosphere • The Degrees of Freedom for Signal (DOFS) (the trace, or summation over the rows of the averaging kernel matrix) give a measure of how many independent pieces of information are retrieved
TES ozone profile retrieval characteristics Degrees of Freedom for Signal Pressure / hPa Latitude / degrees N Averaging kernel Sensitivity in mid- to lower troposphere
TES ozone profile retrieval characteristics Degrees of Freedom for Signal Pressure / hPa Latitude / degrees N Averaging kernel Sensitivity in mid- to lower troposphere Smoothing of information across the tropopause
TES ozone profile retrieval characteristics Degrees of Freedom for Signal Pressure / hPa Latitude / degrees N Averaging kernel More than 1 piece of independent information in NH troposphere (c.f. 3-4 for full profile retrieval) Sensitivity in mid- to lower troposphere Smoothing of information across the tropopause
Sonde No assim Assim Comparison to IONS-06 ozonesonde profiles, August 2006 AM2-Chem Pressure / hPa Pressure / hPa GEOS-Chem Pressure / hPa Pressure / hPa Ozone / ppbv % difference
Comparison to IONS-06 ozonesonde profiles, August 2006 AM2-Chem Pressure / hPa Pressure / hPa Sonde No assim Significant improvement in mid-tropospheric ozone distribution following assimilation. GEOS-Chem Assim Pressure / hPa Pressure / hPa Ozone / ppbv % difference
Objective: Integrate satellite data to better quantify the budget of tropospheric O3 Tropospheric Emission Spectrometer • One of four instruments on the NASA EOS Aura platform, launched July 14 2004 • Sun-synchronous orbit as part of the A-train, with 1.43pm ascending node • Infrared Fourier transform spectrometer with spectral range from 650-3050 cm-1 at 0.1 cm-1 spectral resolution • Nadir footprint = 8 km x 5 km • Observations spaced about 5º along orbit track • Orbit repeats every 16 days • Data products include tropospheric ozone, carbon monoxide, methane, water vapour, and temperature
Role of ozone in chemistry-climate coupling • Ozone has both significant direct and indirect effects on radiative forcing while playing a key role in air quality • How will ozone amplify or dampen future climate change? • How will climate change effect future air quality? Sitch et al,(2007), Nature Mickley et al,(2004), JGR