Spearman Rho Correlation Coefficient
250 likes | 297 Views
Spearman's rank correlation coefficient evaluates the level of association between two variables using a monotonic function. It ranges from +1 to -1, signifying positive or negative correlations. Calculation involves converting raw scores to ranks and deriving differences. Directionality is indicated by the correlation sign. An example illustrates correlation determination based on IQ and study hours data. Spearman Rho aids in interpreting relationships, as seen in student rankings for Math and Science. The article titled “Motivation and Attitude in Learning English among UiTM Students in the Northern Region of Malaysia” explores English learning motivations.

Spearman Rho Correlation Coefficient
E N D
Presentation Transcript
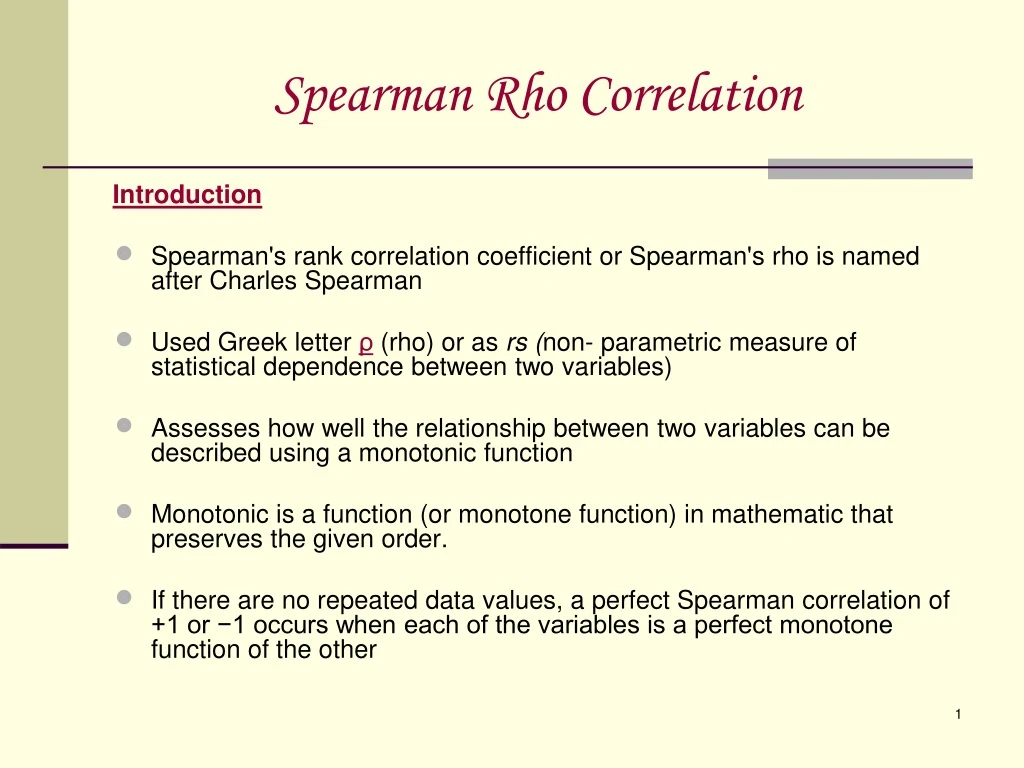
Spearman Rho Correlation Introduction • Spearman's rank correlation coefficient or Spearman's rho is named after Charles Spearman • Used Greek letter ρ (rho) or as rs (non- parametric measure of statistical dependence between two variables) • Assesses how well the relationship between two variables can be described using a monotonic function • Monotonic is a function (or monotone function) in mathematic that preserves the given order. • If there are no repeated data values, a perfect Spearman correlation of +1 or −1 occurs when each of the variables is a perfect monotone function of the other
Spearman Rho Correlation • A correlation coefficient is a numerical measure or index of the amount of association between two sets of scores. It ranges in size from a maximum of +1.00 through 0.00 to -1.00 • The ‘+’ sign indicates a positive correlation (the scores on one variable increase as the scores on the other variable increase) • The ‘-’ sign indicates a negative correlation (the scores on one variable increase, the scores on the other variable decrease) +1 0 -1 Perfect Positive Correlation Perfect Negative Correlation No Correlation 2
Spearman Rho Correlation Calculation Often thought of as being the Pearson correlation coefficient between the ranked (relationship between two item) variables The n raw scores Xi, Yi are converted to ranks xi, yi, and the differences di = xi − yi between the ranks of each observation on the two variables are calculated If there are no tied ranks, then ρ is given by this formula: 3
Spearman Rho Correlation Calculation • Often thought of as being the Pearson correlation coefficient between the ranked (relationship between two item) variables • The n raw scores Xi, Yi are converted to ranks xi, yi, and the differences di = xi − yi between the ranks of each observation on the two variables are calculated • If there are no tied ranks, then ρ is given by this formula:
Spearman Rho Correlation Interpretation • The sign of the Spearman correlation indicates the direction of association between X (the independent variable) and Y (the dependent variable) • If Y tends to increase when X increases, the Spearman correlation coefficient is positive • If Y tends to decrease when X increases, the Spearman correlation coefficient is negative • A Spearman correlation of zero indicates that there is no tendency for Y to either increase or decrease when X increases
Spearman Rho Correlation Interpretation cont…/ • Alternative name for the Spearman rank correlation is the "grade correlation” the "rank" of an observation is replaced by the "grade" • When X and Y are perfectly monotonically related, the Spearman correlation coefficient becomes 1 • A perfect monotone increasing relationship implies that for any two pairs of data values Xi, Yi and Xj, Yj, that Xi − Xj and Yi − Yj always have the same sign
Spearman Rho Correlation Example # 1 • Calculate the correlation between the IQ of a person with the number of hours spent in the class per week • Find the value of the term d²i: 1. Sort the data by the first column (Xi). Create a new column xi and assign it the ranked values 1,2,3,...n. 2. Sort the data by the second column (Yi). Create a fourth column yi and similarly assign it the ranked values 1,2,3,...n. 3. Create a fifth column di to hold the differences between the two rank columns (xi and yi).
Spearman Rho Correlation Example # 1 cont…/ 4. Create one final column to hold the value of column di squared.
Spearman Rho Correlation Example # 1- Result • With d²i found, we can add them to find d²i = 194 • The value of n is 10, so; ρ = 1- 6 x 194 10(10² - 1) ρ = −0.18 • The low value shows that the correlation between IQ and hours spent in the class is very low
Spearman Rho Correlation Example # 2: 5 college students have the following rankings in Mathematics and Science subject. Is there an association between the rankings in Mathematics and Science subject.
Spearman Rho Correlation Example # 2 cont…/ • Compute Spearman Rho n= number of paired ranks d= difference between the paired ranks (when two or more observations of one variable are the same, ranks are assigned by averaging positions occupied in their rank order)
Spearman Rho Correlation Example # 2 cont…/
Spearman Rho Correlation Example # 2- Result Result: ρ = -0.5 There is a moderate negative correlation between the Math and Science subject rankings of students Students who rank high as compared to other students in their Math subject generally have lower Science subject ranks and those with low Math rankings have higher Science subject rankings than those with high Math rankings. (The formula for Pearson r and Spearman rho are equivalent when there are no tied)
Research Article • Title: “Motivation and Attitude in Learning English among UiTM Students in the Northern Region of Malaysia” • Purpose: To describe the relationship between the students’ motivation and attitude to their English Language performance
Article Cont…/ Method: • Used a correlational research design • Independent variables: Motivation, attitude, and personal characteristicsvariables, as measured by a self-report questionnaire • Dependent variable: English Language performance, measured by the UiTM Preparatory English (BEL100) examination result
Article Cont…/ Method: • Sampling Design The subjects were 139 students from the Perlis Campus, 248 from the Kedah Campus and 233 from the Pulau Pinang Campus. • The selection criterion used in attaining the samples was to choose those students who had just received their BEL100 examination result regardless of their status whether as the first timer or repeater for that particular paper.
Article Cont…/ Method: • Questionnaire Research instrument used was questionnaire that comprised questions on personal characteristics, motivation and attitudes. The instrument was adopted and adapted from Gardner andLambert (1972) so that it is more appropriate, intelligible and meaningful for the sample concerned. The reliability test of the instrument produced a Cronbach Alfa of 0.757, which was satisfactory and acceptable.
Article Cont…/ Method: • Data Analysis The data collected were computed and analyzed using the SPSS 12. Each student’s score on the questionnaire was matched to his or her BEL100 examination grade. The statistical procedures used in this study were the descriptive statistics – mean & standard deviation scores, frequency & percentage, t-test, Spearman Rho Rank-Order Correlation Coefficient & ANOVA.
Article Cont…/ Result- Correlation between motivation in learning English & English language performance • Spearman Rho rank-order correlation coefficient test Very weak relationship between Intrinsic Motivation & English language performance, which is -.020. • One-way ANOVA test Intrinsic Motivation: Critical value of F at alpha = .05 is 2.70. The obtained F value is 1.63, which is less than the critical value. Extrinsic Motivation: Computed value for the correlation test which is .043 and the obtained value of F for the one-way ANOVA, 2.39. This justifies there is no significant differences between Overall Motivation (Intrinsic Motivation & Extrinsic Motivation) & English language performance.
Article Cont…/ Result- Attitude in learning English & English language performance • Spearman Rho rank-order correlation coefficient test Exists a significant correlation (alpha = .01) between the attitude in learning English & English language performance, which is -.152. • One-way ANOVA test F value from the one-way ANOVA test is 6.66, which is greater than the critical value. • Mean scores Respondents received A - M = 3.06, B- M = 2.99, C - M = 2.93, D - M = 2.80), it can be concluded that the respondents who obtained an A (high achievers) have better attitude in learning English compared to the low achievers. This justifies that there is a significant difference between the attitude in learning English & English language performance.
Spearman Rho Correlation References • http://en.wikipedia.org/wiki/Spearman's_rank_correlation_coefficient • http://davidmlane.com/hyperstat/A62436.html • http://www.wellesley.edu/Psychology/Psych205/Spearman.html • www.ccsenet.org/journal.html • www.statisticallysignificantconsulting.com • http://www.wikihow.com/Calculate- Spearman's-Rank-Correlation-Coefficient • http://en.wikipedia.org/wiki/Spearman%27s_rank_correlation_coefficient
Prepared by: Rubiyatul Huda Norsafrina Salina Thank you