
Uploaded by
beverly-johns
1 SLIDES
148 VIEWS
20LIKES
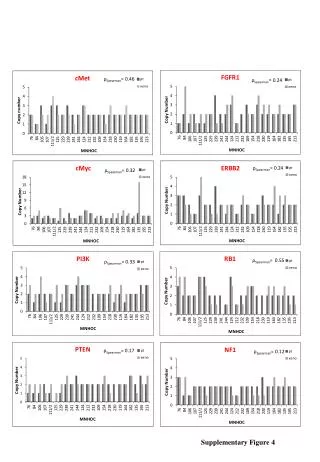
Correlation Analysis of Key Variables in Supplementary Figure 4
DESCRIPTION
This analysis presents Spearman correlation coefficients among various variables as depicted in Supplementary Figure 4. The values include a range of correlations, with significant coefficients such as 0.55 indicative of a strong relationship, while others like 0.12 suggest weak associations. These results provide insights into the interplay of the studied variables, allowing for a better understanding of their interactions and potential implications in the context of the research. Further exploration of these correlations can inform future studies.
Download
1 / 1
Download Presentation 
Correlation Analysis of Key Variables in Supplementary Figure 4
An Image/Link below is provided (as is) to download presentation
Download Policy: Content on the Website is provided to you AS IS for your information and personal use and may not be sold / licensed / shared on other websites without getting consent from its author.
Content is provided to you AS IS for your information and personal use only.
Download presentation by click this link.
While downloading, if for some reason you are not able to download a presentation, the publisher may have deleted the file from their server.
During download, if you can't get a presentation, the file might be deleted by the publisher.
E N D
Presentation Transcript
ρSpearman= 0.46 ρSpearman= 0.24 ρSpearman= 0.24 ρSpearman=0.32 ρSpearman= 0.55 ρSpearman=0.33 ρSpearman= 0.17 ρSpearman= 0.12 Supplementary Figure 4
More Related
Audio
Live Player