Earth Remote Sensing*
170 likes | 211 Views
Remote Sensing is using EM Radiation to study Earth's oceans, land, and atmosphere without physical contact. Sensors on satellites measure reflected or emitted radiation to infer various ocean features. This technology has a profound history and continues to evolve with new applications and satellites like ICESat and CALIPSO. Ocean color observations, diatoms, dinoflagellates, and coccolithophorids are some examples of what can be studied through remote sensing, providing valuable insights into marine ecosystems and environmental changes.

Earth Remote Sensing*
E N D
Presentation Transcript
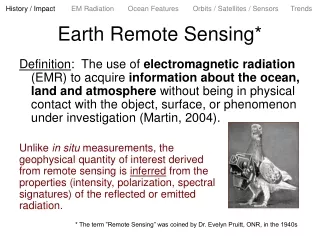
History / Impact EM Radiation Ocean Features Orbits / Satellites / Sensors Trends Earth Remote Sensing* Definition: The use of electromagnetic radiation (EMR) to acquire information about the ocean, land and atmosphere without being in physical contact with the object, surface, or phenomenon under investigation (Martin, 2004). Unlike in situ measurements, the geophysical quantity of interest derived from remote sensing is inferred from the properties (intensity, polarization, spectral signatures) of the reflected or emitted radiation. * The term ”Remote Sensing” was coined by Dr. Evelyn Pruitt, ONR, in the 1940s
History / Impact EM Radiation Ocean Features Orbits / Satellites / Sensors Trends Satellite-borne sensors record emitted and/or reflected radiation, and ocean features are inferred from the radiation measurements Ocean color Ice concentration Ship wakes Oil slicks Coral reefs Passive Reflected Sea surface temperature Surface wind speeds Ice concentration Night time lights Emitted Transmitted Sea sfc height Surface winds Wave heights Ice conc., age Oil slicks Ship wakes Reflected Active Active sensors are both source and receiver of the radiation
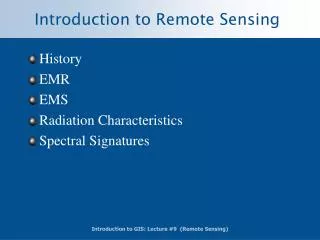
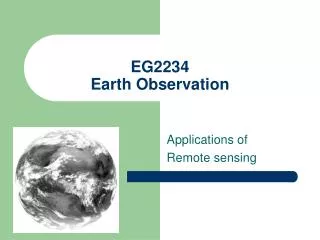
visible infrared microwave History / Impact EM Radiation Ocean Features Orbits / Satellites / Sensors Trends Ocean Remote Sensing What are we sensing? Electromagnetic Radiation (EMR) What phenomena do we infer from the radiation measurements? Chlorophyll, Sea Ice Oil Slicks, Shoals Surface Temperature Ice Concentration Surface Winds Sea Level Wave Heights We use the visible, infrared, and microwave portions of the electromagnetic spectrum
Microwaves are usually denoted by frequency (gigahertz) Visible and IR are usually denoted by wavelength (microns or nanometers) http://physics.uoregon.edu/~jimbrau/BrauImNew/Chap03/FG03_09.jpg
History / Impact EM Radiation Ocean Features Orbits / Satellites / Sensors Trends Satellite-borne sensors record emitted and/or reflected radiation, and ocean features are inferred from the radiation measurements Passive Visible solar radiation reflects from Earth’s surface and from particles and organisms in the ocean. The Earth (land, ocean, and atmosphere) emits infrared and microwave radiation. Active Most active sensors transmit microwave radiation and receive some of the energy which reflects back from Earth’s surface. There are two new satellites (ICESat and CALIPSO) which use lidar (visible and infrared lasers) for Earth remote sensing.
History / Impact EM Radiation Ocean Features Orbits / Satellites / Sensors Trends Oceanographic Applications and Primary Satellites / Sensors
History / Impact EM Radiation Ocean Features Orbits / Satellites / Sensors Trends Ocean Color Observations http://seawifs.gsfc.nasa.gov/SEAWIFS/IMAGES/IMAGES.html
Coastal Upwelling Oregon & California 6 October 2002 NASA / Terra MODIS • Visible light emitted from the sun reflects off suspended particles • Based on the nature and quantity of this reflected light, we can make estimates of chlorophyll concentration (primary productivity) and water clarity
History / Impact EM Radiation Ocean Features Orbits / Satellites / Sensors Trends Diatoms • Most abundant plankton • Nutrient rich, high latitudes • 2-1000 m • autotrophic • chlorophyll in chloroplasts – absorb red and blue • Appear yellow-brown (“Golden Algae”) From www.dnr.state.md.us Diatom Bloom off mid-Atlantic coast (from http://seawifs.gsfc.nasa.gov/)
History / Impact EM Radiation Ocean Features Orbits / Satellites / Sensors Trends Dinoflagellates • Unicellular • Autotrophic, heterotrophic or mixotrophic • Rapid reproduction can lead to red tides • Some produce neurotoxins Ceratium 50 mm Red Tide
History / Impact EM Radiation Ocean Features Orbits / Satellites / Sensors Trends Coccolithophorids • Shells composed of calcium coccoliths – milky white appearance • Able to thrive in nutrient-poor conidtions http://oceancolor.gsfc.nasa.gov/cgi/image_archive.cgi Photo by Kurt Buck, 1995 http://www.mbari.org/~reiko/work/phyto.htm
50 km TERRA MODIS, 21 JUN 04: Coccolithophore blooms off of Iceland http://visibleearth.nasa.gov
History / Impact EM Radiation Ocean Features Orbits / Satellites / Sensors Trends Ocean Color Applications • Ocean Color features are caused by scattering and absorption of visible wavelengths by: • Plankton (also emit certain wavelengths) • Represent 25% of global vegetation • Provide food for zooplankton and fish • Convert CO2 into carbon; important in global carbon cycle • Harmful Algal Blooms • Colored Dissolved Organic Matter (CDOM) or “Gelbstoff” – organic runoff, detritus, decaying matter • Sediments, Pollutants • Ocean optical properties (scattering and absorption) affect swimmer visibility, submarine vulnerability, and performance of electro-optical systems (underwater video, laser) • Features indicate positions of fronts, eddies, and direction of currents
History / Impact EM RadiationOcean FeaturesOrbits / Satellites / Sensors Trends Oceanographic Remote Sensing • Satellite remote sensing has revolutionized oceanography, opening our eyes to energetic small scale (50-200 km) processes • A wide variety of observations are available • Some observations, such as sea ice concentration, are now available for relatively long periods of time (~30 years) • Applications support scientific, commercial and military interests Walter Munk: “1 + 1 = 3” (When satellite data is combined with in situ ocean observations, the resulting info is worth more than the sum of two separate measurements).
Links • Imagery from NASA • Visible Earth: http://visibleearth.nasa.gov/ • Earth Observatory (including “Image of the Day”): http://earthobservatory.nasa.gov/ • Imagery from NOAA • Geostationary Satellite Server: http://www.goes.noaa.gov/ • CoastWatch: http://coastwatch.noaa.gov/cw_index.html • NOAA NESDIS Education and Outreach • http://www.nesdis.noaa.gov/outreach_edu.html • NASA Remote Sensing Tutorial • http://rst.gsfc.nasa.gov/ • Visualization of Satellites on Orbit • http://science.nasa.gov/Realtime/jtrack/3d/JTrack3D.html
Links • Ocean Color • Brief Overview: http://disc.gsfc.nasa.gov/oceancolor/index.shtml • Data and Imagery Gallery: http://oceancolor.gsfc.nasa.gov/ • http://nasascience.nasa.gov/earth-science/oceanography/living-ocean/remote-sensing • Sea Surface Temperature, Topography, Winds • NASA JPL: http://podaac-www.jpl.nasa.gov/ • Overview of POES and GOES (NOAA) • http://www.nesdis.noaa.gov/satellites.html • DMSP Program • Historical Overview: http://www.aero.org/publications/crosslink/winter2005/02.html • Data Archive, Research, Products:http://www.ngdc.noaa.gov/dmsp/index.html • NPOESS Program • http://www.npoess.noaa.gov/ • CORONA Program • http://www.nro.gov/corona/facts.html