Download
1 / 41
420 likes | 621 Views
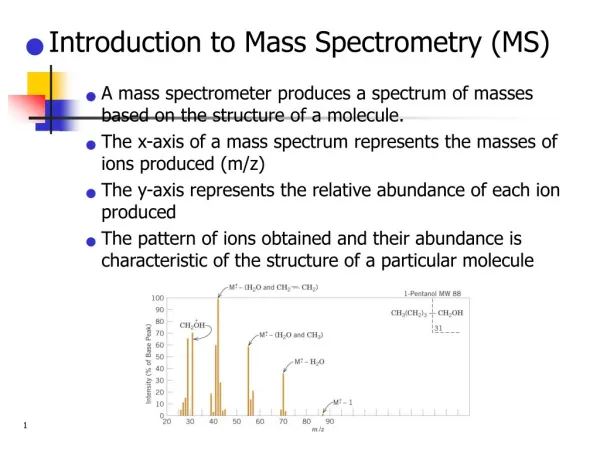
Introduction to high-throughput analysis of proteins and metabolites by Mass Spectrometry. The basic principle Brief introduction of techniques Computational issues. Background. High-throughput profiling of biological samples. Red line: central dogma Blue line: interaction. Metabolites.

E N D
Introduction to high-throughput analysis of proteins and metabolites by Mass Spectrometry The basic principle Brief introduction of techniques Computational issues
Background High-throughput profiling of biological samples Red line: central dogma Blue line: interaction Metabolites (Picture edited from http://www.ncbi.nlm.nih.gov/Class/MLACourse/Modules/MolBioReview/)
Why Mass Spectrometry The question: In the biological system, there are tens of thousands (species) of proteins and metabolites. How to identify and quantify them from a sample? Which protein is this? Does it change significantly between control/disease samples?
Background In a complex network, even if we know the entire structure, the network behavior is hard to predict. Direct profiling gives us snapshots of the status of the system. (Picture from KEGG PATHWAY)
Why Mass Spectrometry Proteins/metabolites could be separated according to their properties: mass/size hydrophilicity/hydrophobicity binding to specific ligands charge … … … … Using Chromatography Electrophoresis … … … … http://en.wikibooks.org/
Why Mass Spectrometry Problems with these separation techniques: Reproducibility Identification / Quantification Inability to separate tens of thousands of species Mass Spectrometry: Highly accurate, highly reproducible measurements Theoretical values easy to obtain identification Can study protein modifications (small ligands attached) Measurements based on mass/charge ratio (m/z)
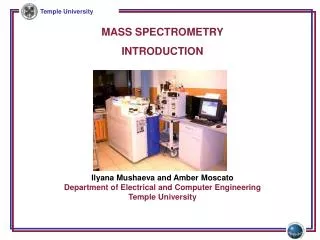
Mass Spectrometry --- getting ion from solution to gas phase Picture provided by Prof. Junmin Peng (Emory) Matrix assisted laser desorption ionization (MALDI) Electrospray ionization (ESI)
Mass Spectrometry --- finding m/z Time-of-flight: Putting a charged particle in an electric field, the time of flight is k: a constant related to instrument characteristics
Mass Spectrometry --- finding m/z Quadrupole: Radio-frequency voltage applied to opposing pair of poles. Only ions with a specific m/z can pass to the detector at each frequency.
Mass Spectrometry --- finding m/z Fourier transform MS. Ions detected not by hitting a detector, but by passing by a detecting plate. Ions detected simultaneously. Very high resolution. m/z detected based on the frequency of the ion in the cyclotron.
Why is simple MS not enough A biological sample consists of tens of thousands of species of molecules. The resolution is not enough for clear separation. Biological interactions between the molecules may interfere with ionization. The solution: Multi-dimensional separation: combining MS with protein breakage by enzymatic digestion and collision decomposition electrophoresis chromatography
Tandem Mass Spec (MS/MS) for protein identification Picture provided by Prof. Junmin Peng (Emory)
2D gel MS/MS Control samples Differential spots Treatment samples In-gel digestion MS/MS protein identification
2D gel differential protein finding in-gel digestion MS/MS protein identification Int J Biol Sci 2007; 3:27-39
LC/MS Liquid chromotography retention time Take “slices” in retention time, send to MS Mass-to-charge ratio (m/z)
LC/MS-MS Picture provided by Prof. JunminPeng (Emory)
LC/MS-MS Here is an example of LC/MS spectrum. The second MS serves the purpose of protein identification. Matching the sequence found by the second MS falls into the realm of sequence comparison and database search. Peak quantification is done by the first MS. (a) Original spectrum; (b) square root-transformed spectrum to show smaller peaks; (c) A portion of the spectrum showing details.
Between proteomics and metabolomics Proteomics uses LC/MS-MS. The second MS is for protein identification. Metabolomics uses LC/MS. Sometimes a second MS is used, but data interpretation for metabolite identification is much harder. What concerns statisticians: (1) The shared LC/MS part: In metabolomics: quantification, identification In proteomics: quantification (2) The second MS: Protein identification: sequence modeling/comparison Protein quantification: merging values from different peptides from the same protein.
Some computational issues in LC/MS-MS Modeling peaks. Noise reduction & peak detection Multiple peaks from one molecule caused by (1) isotopes (2) multiple charge states Retention time correction. Peak alignment. Peak quantification, especially with overlapping peaks caused by m/z sharing (mostly in metabolomics) From peptides to proteins.
Modeling peaks In high-resolution LC/MS data, every peak is a thin slice --- there is no need to model the MS dimension. Modeling the LC dimension is important for quantification. Models have been developed for traditional LC data, which can be applied here. Most empirical peak shape models were derived from Gaussian model. Changes were made to account for asymmetry in the peak shape.
Modeling peaks Asymmetric peak. “asymmetry factor”: b/a at 0.1h Data Analysis and signal processing in chromatography. A. Felinger
Modeling peaks The bi-Gaussian model: The area under peak is: Data Analysis and signal processing in chromatography. A. Felinger
Modeling peaks Generalized exponential function Data Analysis and signal processing in chromatography. A. Felinger
Modeling peaks Log-normal function. Data Analysis and signal processing in chromatography. A. Felinger
Noise reduction Reviewed by Katajamaa&Oresic (2007) J Chr. A 1158:318
Noise reduction Signal-to-noise (S/N) ratio Where to make the cut? Should it be a straight line or a smoother? http://www.appliedbiomics.com/Service/Promotions/promotions.html
Noise reduction & peak detection Using filters to detect peak from noise in conjunction with hard cutoff. Anal Chem. 2006 Feb 1;78(3):779-87.
Noise reduction & peak detection Matched filter. Calculate the convolution of the signal (x) with the reverse of the standardized peak shape model (f). Try to minimize with regard to the peak height alpha and the peak location tau. Take differential: Data Analysis and signal processing in chromatography. A. Felinger
Noise reduction & peak detection With data from Gaussian model: The above equations become: The goal is to find where The corresponding is the peak intensity. Data Analysis and signal processing in chromatography. A. Felinger
Noise reduction & peak detection Data Analysis and signal processing in chromatography. A. Felinger
Retention time correction With every run, the LC dimension data has some fluctuation. Identify “reliable” peaks in both samples, use non-linear curve fitting to adjust the retention time. Anal Chem. 2006 Feb 1;78(3):779-87.
Multiple peaks from one molecule Caused by multiple charge states (z = 1, 2, 3,……), and different number of carbon isotopes present in the molecule. Example: m=1000 (all C12) 1000 1001 1002 1003 333.33 333.67 334 500 500.5 501 501.5 3 charges 2 charges single charge
Peak alignment Reviewed by Katajamaa&Oresic (2007) J Chr. A 1158:318
Peak alignment Dynamic programming. BMC Bioinformatics 2007, 8:419
Peak alignment First align m/z dimension by binning. Use kernel density estimation to find “meta-peaks”. Anal Chem. 2006 Feb 1;78(3):779-87.
Dealing with overlapping peaks (1) Matched filter. (2) Some traditional methods. Data Analysis and signal processing in chromatography. A. Felinger
Dealing with overlapping peaks (3) Statistical modeling using the EM algorithm Bi-Gaussian mixture Gaussian mixture
An example of the overall strategy in LC/MS metabolomics Anal Chem. 2006 Feb 1;78(3):779-87.
Beyond LC/MS-MS In a complex biological sample (cell, tissue, serum, … ), there are several thousand proteins – tens of thousands of peptides after digestion; signal from less-abundant species may be suppressed. Solution: Must reduce complexity to identify and quantify proteins. Incorporate biochemical separation techniques: LC-MS/MS LC/LC-MS/MS …… 2D gel-MS/MS 2D gel/LC-MS/MS Affinity column separation – LC-MS/MS Separate proteins in multiple dimensions. Sacrifice speed. Analyze a subset of proteins. Sacrifice coverage.
Beyond LC/MS-MS Nature. 452:571. Fig. 1 Right: LC/LC/LC-MS/MS