Analytics Workshop: Creating Dashboards in Benchmark & Monitor
Explore the significance of dashboards and KPIs in this instructor-led workshop. Learn to create a customized Coremetrics Dashboard aligned with business goals. Gain insights on benchmarking, real-time monitoring, and improving site performance.

Analytics Workshop: Creating Dashboards in Benchmark & Monitor
E N D
Presentation Transcript
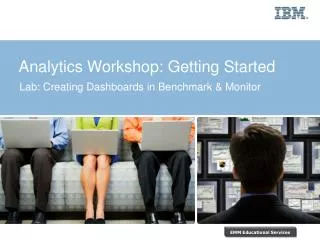
Analytics Workshop: Getting Started Lab: Creating Dashboards in Benchmark & Monitor
Today’s Session • Purpose:This learning lab is an instructor-led, hands on workshop that will guide participants through the creation of a customized KPI Dashboard which correlates to business objectives. • Objectives: At the end of this course participants will be able to: • Understand the importance of Dashboards and KPIs • Understand Coremetrics Benchmark and Real Time Monitor • Create a customized Coremetrics Dashboard with actionable KPIs
Lesson 1: Objectives • At the end of this lesson participants will be able to understand: • How to effectively utilize Dashboards and KPIs • The criteria for creating effective Dashboards • How identifying and monitoring relevant KPIs enhances productivity
High Impact Dashboards Data Tags
KPIs • Overview: Enhance productivity and continual site improvement with proactive strategies. • KPIs allow you to: • Identify areas requiring attention • Quantify the effects of initiatives • Confirm and communicate results • Manage expectations and priorities • Overcome organizational hurdles
Lesson 2: Objectives • At the end of this lesson participants will be able to: • Utilize the functionality available with Coremetrics Benchmark and Real Time Monitor • Create a customized Dashboard using actionable KPIs
How is the competition performing? • Overview: Glean insight into industry wide performance to benchmark against the competition and discover where to optimize to yield the highest returns. • Highlights of Features: • View performance of peers • Customizable modules • Best Practice Dashboards • Customizable views per user • Timeframe comparison
Coremetrics Monitor • Overview: Enables users to view critical site metrics in real time with live streaming data, updating every 5 -10 minutes, allowing for educated last minute decisions. • Highlight of Features: • Use Top Line Compare to compare time periods • Insert Date Annotations as a visual reminder of an event which caused a spike or decline in data • View Insights to obtain further guidance
Session Recap • In today’s session we discussed: • The value of Dashboards when utilizing Benchmark and Monitor • How to build customized dashboards
Next Steps • Identify vital metrics to be tracked • Target the most useful modules within each dashboard • Implement various dashboards with identified metrics and targeted modules
Post-Class Support • On-Demand Training: • Benchmark • Monitor • Documentation: • User Guide: Benchmark and Monitor • Getting Started Guide • Participant Guide • Expert Analysts: • Submit a ticket or chat live for assistance