Download
1 / 53
550 likes | 1.01k Views
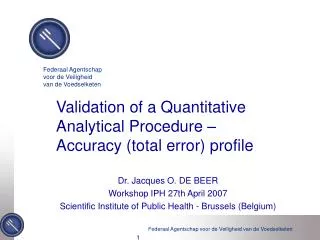
Validation of a Quantitative Analytical Procedure – Accuracy (total error) profile. Federaal Agentschap voor de Veiligheid van de Voedselketen. Dr. Jacques O. DE BEER Workshop IPH 27th April 2007 Scientific Institute of Public Health - Brussels (Belgium).

E N D
Validation of a Quantitative Analytical Procedure – Accuracy (total error) profile Federaal Agentschap voor de Veiligheid van de Voedselketen Dr. Jacques O. DE BEER Workshop IPH 27th April 2007 Scientific Institute of Public Health - Brussels (Belgium)
Method Validation – General Concepts • Different regulations relating to GLP, GMP, GCP (OECD, EU) • Normative or Regulatory documents (ISO 17025, ICH, EMEA, FDA, dir. 2002/657/EG) both suggest that analytical procedures have to comply to certain acceptance criteria. • This request imposes that these procedures are to be validated. - Some documents define the validation criteria - No proposals on experimental approaches !! - Limited to general concepts !!
Introduction - Definition • Method Validation: is the confirmation by examination and the provision of objective evidence that the particular requirements for a specific intended use are fulfilled. EN ISO/IEC 17025 § 5.4.5.1 • Methods need to be validated or revalidated: • before introduction into routine application • whenever conditions change for which the method has been validated (e.g. Instrument with different characteristics) • whenever the method is modified and modifications are outside original scope of the method.
European and International regulatory bodies and their guidelines on different aspects of QA
Objectives of an analytical procedure • Able to quantify as accurately as possible each unknown quantity to be determined. • After analysis: the difference between returned result x and the unknown “true value µT” be small or < acceptance limit λ: - < x - µT < λ x - µT < λ (eq.1) • λ : depends on objective of analytical procedure e.g. 1-2 % on bulk, 5 % on pharmaceuticals, 15 % for biological samples previously defined
Objectives of an analytical procedure • Analytical procedures characterized by (cfr. def.): • “true bias”dM = systematic error (unknown) • “true precision”σ²M = random error measured by a standard deviation or variance (unknown) • Estimates of bias and precision obtained by experiments during the validation • Reliability of these estimates depends on adequacy of experiments on known samples (Valid. Stds),experimental design, number of experiments • These estimates an intermediary but obligatorystep to evaluate if procedure is likely or not to quantify with sufficient accuracy the unknown quantities; not objectives per se
Examples of procedures having the same acceptance limits l = ± 15% Procedure 1 Procedure 2 Bias = +7 % RSD = 3% Bias = +1 % RSD = 8% Procedure 3 Procedure 4 Bias = 0 % RSD = 20% Bias = +7 % RSD = 12%
Objectives of an analytical procedure • Figure: 4 different (hypothetical) methods giving the distribution of 95% of the measures • Each method has a true bias dM , a true precision σ²M, a common acceptance limit λ (= 15% bioanalytical procedure): • Procedure 3: negligible bias (0%); unsatisfactory precision (20% CV); too many measures beyond +/- 15% of the true value; does not fulfill objective • Procedure 4:bias(7%); precision(12%); important proportion outside acceptance limits; does not fulfill objective; but both < 15%: required by Washington Conf. • Procedures 1 and 2: fulfill (valid): at least 95% of results inside acceptance limits
Objectives of an analytical procedure • Procedure 1: presents a bias (+ 7%), but is very precise (3% CV) • Procedure 2: presents a negligible bias (+ 1%), but is less precise (8% CV) FIRST CONCLUSION: Differences between these two procedures don’t matter since results are never too far from true values of the sample to quantify. Quality of results is far more important than the intrinsic characteristic properties of procedure in terms of bias or precision.
Objectives of an analytical procedure • To develop a procedure without bias and error considerable cost; not acceptable strategy • Analyst has to take minimal risks, compatible with the analytical objectives (within reasonable time!!) • Set up acceptable maximum proportion of measurements that might be outside acceptance limits (±): • e.g. 5% or 20 % of measurements outside (±) as maximum risk. • inside triangles (next fig.) space of acceptable procedures characterized by “true bias” dM and a “true precision” s²M • Acceptable procedures: 95, 80, 66% of measurements within ± 15% limits (recommendations Washington Conference) proportion depends on objectives!!!
% measurements within ± 15% bias-precision limits Proc.3 20 (0,20) 15 Proc.4 True precision (%) 66% (7,12) 10 (1,8) 80% Proc.2 5 95% (7,3) -10 -5 0 5 10 0 Proc.1 True bias (%)
Objectives of an analytical procedure • Interior triangle = area of all analytical procedures of which 95% of result X should be included within acceptance limits (±), set according constraints of analytical domain • 2 other triangles: proportions of 80% and 66% of measurements included within ± (accept. limits) • procedure with true bias =0 ; true precision = 15% : only 66% will fall within acceptance limits (±) • procedure with true bias =0 ; true precision = 8% : 95% will fall within acceptance limits (±)
Objectives of an analytical procedure • Figure: procedures 1 and 2 located inside region of acceptance • this region guarantees that at least resp. 95% and 80% of the results are within acceptance limits (±) • for the same risk of the measurements outside acceptance limits, procedures 3 and 4 not considered as valid • for more important risk, procedures 3 and 4 could be valid.
Objectives of an analytical procedure FURTHER CONCLUSION: • Procedure qualified as acceptable if: it “guarantees” that the difference between every sample measurement (x) and its “true value” (µT) is inside the predefined acceptance limits (± l) • In equation: P(x - µT < l) b (eq. 2) b = proportion of measurements inside acceptance limits l = acceptance limit, fixed a priori according objectives of the method • Expected proportion of measurements falling outside the acceptance limits risk of an analytical procedure
Objective of the validation • What ? to give to the laboratories as well to the regulatory bodies“guarantees” that every single measurement performed in routine is close enough to the unknown “true value” of the sample: x - µT < acceptable limit l • Objective of validation: not simply to obtain estimates of bias and precision; it is to evaluate these guarantees and risks • These estimates of bias and precision are required to evaluate risks
Objective of the validation • With respect to this objective, 2 basic notions should be considered: • “close enough”(eq. 1) meaning that routine measure will be less than the acceptance limit λfrom its unknown “true value” • “guaranteed”,(eq. 2) meaning that it is very likely that analysis result will be close enough to the true unknown value.
Objective of the validation • decision tools are needed giving “guarantees” that future measurements are reasonably inside acceptance limits
Decision rules • Current position with respect to the decision rules used in the phase of validation most of them based on use of the null hypothesis: H0 : bias = 0 H0 : relative bias = 0 % H0 : recovery = 100 % • Bias = x - µT • Relative bias = 100 (x - µT)/µT • Recovery = 100 x/µT • A procedure wrongly declared adequate when the 95% C.I. of the average bias includes 0 • Test inadequate in validation context of analytical procedures because decision based on computation of rejection criterion of Student t-test
Test based on H0 = bias = 0 20 (0,20) Proc.3 PROCEDURES VALID 15 (7,12) Proc.4 10 True precision (%) (1,8) Proc.2 5 (7,3) NOT VALID Proc.1 0 -15 -10 -5 5 10 15 0 True bias (%)
Decision rules • According to the decision rule based on the null hypothesis H0 in fig.: procedures 2, 3 and 4 are valid and procedure 1 is rejected • But: procedure 1 shows reduced bias (+ 7%) and a small RSD (3%) outside triangle: rejected !! • procedure 3 has high RSD (20%), procedure 4 has bias of 7% and RSD of 12% accepted !! • bad precision large C.I. contains 0 as bias value method accepted • good precision small C.I. may not contain 0 as bias value method rejected null hypothesis H0 inadequate in analyt. validation
Test based on acceptance limits (± 15%) 20 (0,20) Proc.3 PROCEDURES NOT VALID 15 Proc.4 (7,12) 10 True precision (%) (1,8) Proc.2 5 β≥ 80% (7,3) 0 -15 -10 -5 5 10 15 0 Proc.1 True bias (%)
Decision rules • According to the decision rule based on use of acceptance limits triangle in fig. with acceptible valid procedures • Triangle in fig. corresponds to procedures with measurementproportion inside acceptance limits (±λ) ≥a priorichosen proportion (e.g. 80%) as given by equation: P(x - µT < l) b (eq. 2) • more sensible decision rule: procedures with good precision accepted bad precision rejected • Biased procedure small variance: acceptable !! • Procedure with higher variance needs small bias
Decision rules: Accuracy profile • easy and visual decision rule: use of the accuracy profile within the acceptance limits (± l) • Accuracy profile constructed from the β-expectation intervals on the expected measurements: - allows to decide on capability of analytical procedure to give results inside ± l - describes dosage interval (range) in which the procedure is able to quantify with known accuracy and a fixed risk at the end of the validation • e.g. risk of 5% “guarantee” that 95/100 future measurements will be included in acceptance limits, fixed according requirements (1-2 % on bulk, 5 % on pharmaceut., 15 % in bioanalysis)
Decision rules • Accuracy profile by concentration level (C1, C2, ...) obtained by computing β-expectation tolerance interval allows evaluating the proportion of expected measurements inside acceptance limits • This interval is obtained from available validated estimates of the bias and precision of the procedure (by concentration level) • This interval of measurements expected within level b (= proportion of measurements inside l) has b-expectation confidence limits
Decision rules • If for each concentration level jβ-expectation toleranceinterval are included within acceptance limits method accepted! • Tolerance interval calculation: - what matters is: the guarantee of the results, expected in the future by the same analytical procedure in routine - estimation of µj, s²B,j, s²W,j at every conc. j are used to estimate the expected proportion of observations within the predifined acceptance limits [-l,+l], i.e.: Eµ,s P[x - µT < l]dM, sM b
Calculation of β-expectation tolerance interval • estimated bias (mean added concentrations minus mean calculated concentrations) • j = conc. level • these statistical parameters (trueness, within/between precision) might be calculated for each concentration level from validation standards.
Calculation of β-expectation tolerance interval • Calculation of the interval in which a proportion β of all samples with a certain real concentration is observed (method of Mee): β expectation tolerance interval: ISO 5725-2: calculation of within and between variance
Calculation of β-expectation tolerance interval n = degrees of freedom (Satterthwaite): p = number of series (days) n = number of replicates per series Qt = β quantile of the Student’s t-distribution with ν degrees of freedom
Calculation of β-expectation tolerance interval interval representing in % the region containing β % of analysis results for a certain concentration level j : after rearrangement:
Calculation of β-expectation tolerance interval • Interval consists of two terms: % bias +/- coefficient of variation for intermediate precision = expression of method accuracy method is accurate for this concentration level if obtained tolerance interval is included within acceptance limits [-λ,λ]
Accuracy profile bias (%) + l mean relat. bias 0 acceptance limits concentration bias limits of confidence - l C1 C2 C3 C4 LLQ ULQ RANGE dosage interval
Decision rules • Estimates of bias and variance are essential to compute evaluation of the expected proportion of measurements within acceptance limits • Accuracy profile obtained by connecting the lower or upper limits of confidence (cfr. fig) • If a subsection (concentration range) falls outside the acceptance limits new limits of quantification be defined and a new dosage interval (Upper and Lower Limits of Quantification)
Decision rules (conclusion) • Accuracy profile represents limits “ULQ and LLQ” in agreement with definition of criterion: LLQ = smallest quantity of the substance that can be measured with defined accuracy • Accuracy profile as single decision tool: • Allows reconciling the objectives of the procedure and those of the validation • Allows to visually grasp the capacity of the procedure to fulfill its analytical objective
Validation Protocols: Life Cycle • Validation has to be considered as an element intervening after the development of a new analytical procedure • Objective of procedure = to be used in routine • Usage in routine must be coupled with a quality control (QC) of which the 2 objectives are: • the validity of the found results on the unknown samples • the assessment of the continuity of the performances of the procedure at the time of its exploitation
Protocols in validation phase Main objectives in validation phase: • demonstrate specificity/selectivity • validate the response function (or calibration model used in routine) • estimate precision (repeatability and intermediate precision), trueness, accuracy • validate the quantitation limits, validate the range (dosage interval); cfr. accuracy profile! • assess linearity of the analytical procedure (results directly proportional to concentration in the sample – cfr. definitions)
Protocols in validation phase • preparation of calibration standards (CS) with fixed number of concentration levels and repetitions by level • preparation of the validation standards (VS) in the matrix; are independent samples • VS prepared and treated independenly as future samples essential for good estimation of between-series variance. • To estimate intermediate precision, VS analyzed on different days, equipment and by different operators. • Validation phase is ultimate stage before exploitation; allows to estimate procedure’s performances in the expected experimental conditions allows to check procedure’s capability to quantify unknown sample
Protocols in validation phase • Question whether or not presence of a matrix effect. • If no matrix effect, question is which concentration levels will be used for calibration apply described validation protocols (V1 and V2) • Evidence of matrix effect: apply protocol V5 • In case of doubt: apply protocols V3 and V4 according to calibration levels (cfr.Table) • Which types of standards (CS and VS), concentration levels? • VS prepared in matrix and independent; must similate future samples
Choise of number of CS and VS depending on selected protocol
Description of protocol V1 Series 1 Series 2 Series 3 R Calibration standards Validation standards (1) (1) Additional validation standards (linearity ICH) (1) Conc
Description of protocol V2 Series 1 Series 2 Series 3 R Calibration standards ( ) ( ) ( ) Validation standards (1) (1) Additional validation standards (linearity ICH) (1) Conc
Description of protocol V3 Series 1 Series 2 Series 3 Calibration Standards without matrix R Calibration Standards within matrix Validation standards (1) (1) Additional validation standards (linearity ICH) (1) Conc
Possible concentation levels by type of procedure (e.g. 6 comparative procedures) • Determination of single chemical substance; reference available or determination of active ingredient in a pharmaceutical speciality (matrix) • Determination of available synthesis impurity in an active substance or pharmaceutical speciality (matrix) at concentration levels > LOQ • Determination of available synthesis impurity in an active substance or pharmaceutical speciality (matrix) around impurity limit (impurity limit > LOQ) • Simultaneous determination of chemical substance and one of its non-available impurities in this substance or pharmaceutical speciality (use substance as tracer to allowed maximum concentration of impurity)
Possible concentation levels by type of procedure (e.g. 6 comparative procedures) • Determination of active substance for measuring dissolution kinetics for a dry dosage form (matrix) • Determination of active ingredient and its metabolites in plasma (drugs), drug residues, ... WHICH CONCENTRATION LEVELS ? cfr. TABLE
Examples of possible concentration levels by type of procedure LA = admitted limit; Cmax = max. conc.; Cmin = min. conc.
Protocols in validation phase • Identify relationship between response Y and concentration X using calibration standards (response function). • Regression models are fitted, accuracy profiles calculated, one model selected decision about validity of the procedure of interest. • Model: depends on procedure type (pharmaceutical, bio-analytical, immuno-assay) fixed method objectives • Linear regression (origin or not) envisaged. • Mathematical transformations applied on X and Y • Quadratic regression may be useful
Protocols in validation phase • Back-calculation of estimated VS concentrations by series by calibration curve equations • For each concentration level estimation of trueness and precision calculation of limitsforaccuracy : cfr. CIj (bias) (include large proportion of results) accuracy profile for each fitted model • Accuracy profile visual decision tool to evaluate capability of the method if not within pre-fixed acceptance limits: - restrict dosis range new limits of quantification - extend acceptance limits (possible??)
ACCURACY PROFILES with same VALIDATION PROTOCOL (0.01 – 5.0 ng/ml) A 15 B 15 quadratic regression Bias (%) Bias (%) weighed linear regression -15 -15 C D 15 15 Bias (%) Bias (%) -15 linear regression -15 linear regression throug 0 linear regression on log transformed data E F linear regression on square root transformed data 15 15 Bias (%) Bias (%) -15 -15 Concentration Concentration 0 1 2 3 4 5 0 1 2 3 4 5
Protocols in validation phase • Figure: Accuracy profiles for validation of dosing procedure of chemical substance in biological matrix. • Protocol V5 applied + some concentration levels • Essentially low levels good estimation of LOQ • 2 of 6 response functions (A: quadratic regress. + B: weighed regression) answer objective: acceptance limits ± 15% accuracy profile allows to decide about method capability: Quantifiable dosing range with known accuracy: 0.01 – 5.0 ng/ml at risk = 5%
CONCLUSIONS • Lack of generalisation between different validation protocols harmonized approach • Proposal to review objectives of the validation according to objectives of the analytical procedure • Distinction between diagnosis rules and decision rules • Objectives of validation not simply to obtain estimates of bias and precision but also: • To evaluate risks or confidences that any single measurement is close enough to unknown true value • Trueness, precision, linearity, ..., no longer sufficient to make these guarantees.
CONCLUSIONS • Adapted decision tool accuracy profile of the analytical procedure, based on: • -expectation tolerance interval at each concentration level • concept of total error (bias + standard deviation) • Allows to bring together objectives of the procedure and those of validation • Allows to visually grasp the capacity of the procedure to fulfil its objectives to control risk associated with its use in routine