Download
1 / 27
270 likes | 385 Views
Explore the realms of data analysis in particle physics, dealing with uncertainty and quantifying probability using advanced statistical methods like Bayesian and frequentist statistics. Understand the significance of random variables, probability density functions, and the application of Bayes' theorem in practical scenarios.

E N D
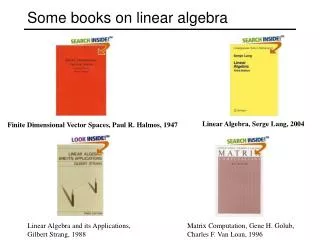
Some statistics books, papers, etc. G. Cowan, Statistical Data Analysis, Clarendon, Oxford, 1998 see also www.pp.rhul.ac.uk/~cowan/sda R.J. Barlow, Statistics, A Guide to the Use of Statistical in the Physical Sciences, Wiley, 1989 see also hepwww.ph.man.ac.uk/~roger/book.html L. Lyons, Statistics for Nuclear and Particle Physics, CUP, 1986 F. James, Statistical Methods in Experimental Physics, 2nd ed., World Scientific, 2006; (W. Eadie et al., 1971). S. Brandt, Statistical and Computational Methods in Data Analysis, Springer, New York, 1998 (with program library on CD) W.-M. Yao et al. (Particle Data Group), Review of Particle Physics, J. Physics G 33 (2006) 1; see also pdg.lbl.gov sections on probability statistics, Monte Carlo Uniovi
Data analysis in particle physics Observe events of a certain type Measure characteristics of each event (particle momenta, number of muons, energy of jets,...) Theories (e.g. SM) predict distributions of these properties up to free parameters, e.g., a, GF, MZ, as, mH, ... Some tasks of data analysis: Estimate (measure) the parameters; Quantify the uncertainty of the parameter estimates; Test the extent to which the predictions of a theory are in agreement with the data (→presence of New Physics?) Uniovi
Dealing with uncertainty In particle physics there are various elements of uncertainty: theory is not deterministic quantum mechanics random measurement errors present even without quantum effects things we could know in principle but don’t e.g. from limitations of cost, time, ... We can quantify the uncertainty usingPROBABILITY Uniovi
A definition of probability Consider a set S with subsets A, B, ... Kolmogorov axioms (1933) From these axioms we can derive further properties, e.g. Uniovi
Conditional probability, independence Also define conditional probability of A given B (with P(B) ≠ 0): E.g. rolling dice: Subsets A, Bindependent if: If A, B independent, N.B. do not confuse with disjoint subsets, i.e., Uniovi
Interpretation of probability I. Relative frequency A, B, ... are outcomes of a repeatable experiment cf. quantum mechanics, particle scattering, radioactive decay... II. Subjective probability A, B, ... are hypotheses (statements that are true or false) • Both interpretations consistent with Kolmogorov axioms. • In particle physics frequency interpretation often most useful, but subjective probability can provide more natural treatment of non-repeatable phenomena: systematic uncertainties, probability that Higgs boson exists,... Uniovi
Bayes’ theorem From the definition of conditional probability we have, and , so but Bayes’ theorem First published (posthumously) by the Reverend Thomas Bayes (1702−1761) An essay towards solving a problem in the doctrine of chances, Philos. Trans. R. Soc. 53 (1763) 370; reprinted in Biometrika, 45 (1958) 293. Uniovi
B The law of total probability Consider a subset B of the sample space S, S divided into disjoint subsets Ai such that [i Ai = S, Ai B∩ Ai → → law of total probability → Bayes’ theorem becomes Uniovi
An example using Bayes’ theorem Suppose the probability (for anyone) to have AIDS is: ←prior probabilities, i.e., before any test carried out Consider an AIDS test: result is + or - ←probabilities to (in)correctly identify an infected person ←probabilities to (in)correctly identify an uninfected person Suppose your result is +. How worried should you be? Uniovi
Bayes’ theorem example (cont.) The probability to have AIDS given a + result is = ? ← posterior probability Uniovi
Frequentist Statistics − general philosophy In frequentist statistics, probabilities are associated only with the data, i.e., outcomes of repeatable observations (shorthand: ). Probability = limiting frequency Probabilities such as P (Higgs boson exists), P (0.117 < as < 0.121), etc. are either 0 or 1, but we don’t know which. The tools of frequentist statistics tell us what to expect, under the assumption of certain probabilities, about hypothetical repeated observations. The preferred theories (models, hypotheses, ...) are those for which our observations would be considered ‘usual’. Uniovi
Bayesian Statistics − general philosophy In Bayesian statistics, use subjective probability for hypotheses: probability of the data assuming hypothesis H (the likelihood) prior probability, i.e., before seeing the data posterior probability, i.e., after seeing the data normalization involves sum over all possible hypotheses Bayes’ theorem has an “if-then” character: If your prior probabilities were p (H), then it says how these probabilities should change in the light of the data. No unique prescription for priors (subjective!) Uniovi
Random variables and probability density functions A random variable is a numerical characteristic assigned to an element of the sample space; can be discrete or continuous. Suppose outcome of experiment is continuous value x →f(x) = probability density function (pdf) x must be somewhere Or for discrete outcome xi with e.g. i = 1, 2, ... we have probability mass function x must take on one of its possible values Uniovi
Cumulative distribution function Probability to have outcome less than or equal to x is cumulative distribution function Alternatively define pdf with Uniovi
Histograms pdf = histogram with infinite data sample, zero bin width, normalized to unit area. Uniovi
Other types of probability densities Outcome of experiment characterized by several values, e.g. an n-component vector, (x1, ... xn) →joint pdf Sometimes we want only pdf of some (or one) of the components →marginal pdf x1, x2 independent if Sometimes we want to consider some components as constant →conditional pdf Uniovi
Expectation values Consider continuous r.v. x with pdf f (x). Define expectation (mean) value as Notation (often): ~ “centre of gravity” of pdf. For a function y(x) with pdf g(y), (equivalent) Variance: Notation: Standard deviation: s ~ width of pdf, same units as x. Uniovi
Covariance and correlation Define covariance cov[x,y] (also use matrix notation Vxy) as Correlation coefficient (dimensionless) defined as If x, y, independent, i.e., , then → x and y, ‘uncorrelated’ N.B. converse not always true. Uniovi
Correlation (cont.) Uniovi
Error propagation Suppose we measure a set of values and we have the covariances which quantify the measurement errors in the xi. Now consider a function What is the variance of to find the pdf The hard way: use joint pdf then from g(y) find V[y] = E[y2] - (E[y])2. may not even be fully known. Often not practical, Uniovi
Error propagation (2) Suppose we had in practice only estimates given by the measured Expand to 1st order in a Taylor series about To find V[y] we need E[y2] and E[y]. since Uniovi
Error propagation (3) Putting the ingredients together gives the variance of Uniovi
Error propagation (4) If the xi are uncorrelated, i.e., then this becomes Similar for a set of m functions or in matrix notation where Uniovi
Error propagation (5) y(x) The ‘error propagation’ formulae tell us the covariances of a set of functions in terms of the covariances of the original variables. sy x sx Limitations: exact only if linear. y(x) Approximation breaks down if function nonlinear over a region comparable in size to the si. ? x sx N.B. We have said nothing about the exact pdf of the xi, e.g., it doesn’t have to be Gaussian. Uniovi
Error propagation − special cases → → That is, if the xi are uncorrelated: add errors quadratically for the sum (or difference), add relative errors quadratically for product (or ratio). But correlations can change this completely... Uniovi
Error propagation − special cases (2) Consider with Now suppose r = 1. Then i.e. for 100% correlation, error in difference → 0. Uniovi
Bayes’ theorem example (cont.) The probability to have AIDS given a + result is ← posterior probability i.e. you’re probably OK! Your viewpoint: my degree of belief that I have AIDS is 3.2% Your doctor’s viewpoint: 3.2% of people like this will have AIDS Uniovi 27