Download
1 / 27
330 likes | 713 Views
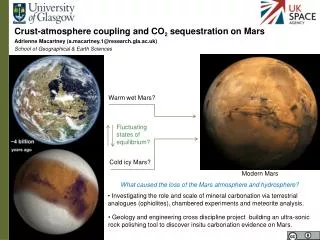
MAVEN: Mission to Mars (Mars Atmosphere and Volatile EvolutioN ). Presented by Dr. Harold A. Geller. Launched: 18 November 2013 Mars Orbit Insertion: 22 September 2014. The MAVEN Spacecraft. Same weight fully loaded as a full-sized SUV ~6000 lbs.

E N D
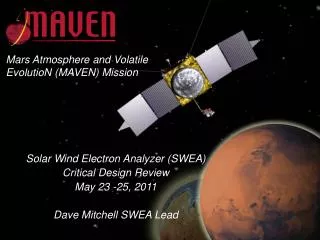
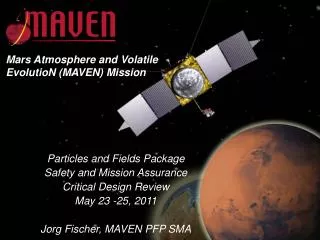
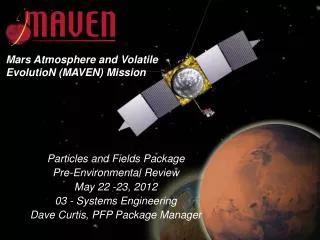
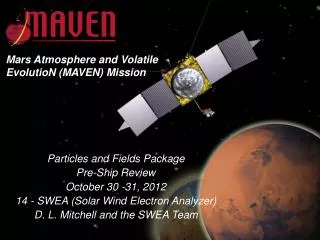
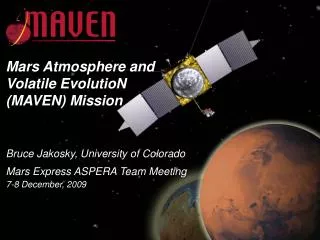
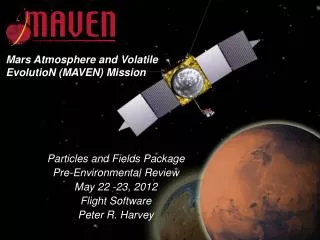
MAVEN: Mission to Mars(Mars Atmosphere and Volatile EvolutioN) Presented by Dr. Harold A. Geller
Launched: 18 November 2013 Mars Orbit Insertion: 22 September 2014
The MAVEN Spacecraft Same weight fully loaded as a full-sized SUV ~6000 lbs Same length as a school bus – wingtip-to-wingtip length of 37ft.
The MAVEN Spacecraft • 3-axis attitude control (wheel based) • Mono-propellant propulsion system • Single-fault tolerant during all critical events • Launch (Wet) Mass: 2550 kg max • Spacecraft Dry Mass: 903 kg max • Power: 1135 W at Mars Aphelion LPW (2) Electra (behind) SWEA SWIA “Gull-Wing” Solar Arrays SEP Fixed HGA MAG (2) SEP Articulated Payload Platform (IUVS/STATIC/NGIMS)
The MAVEN Spacecraft Sun, Solar Wind, Solar Storms LPW (2) SEP SWEA Electra (behind) SWEA SWIA Neutrals and Ions Plus Evolution EUV SWIA Ion-Related Properties and Processes “Gull-Wing” Solar Arrays SEP NGIMS IUVS Fixed HGA MAG (2) SEP Articulated Payload Platform (IUVS/STATIC/NGIMS) LPW STATIC MAG
Two Major Mysteries to Address Primordial Mars Concept 1. Where did the water go?
2. Where Did the Atmosphere Go? Up Down
MAVEN Seeks Answers • How much atmosphere is escaping today? • What processes strip atmospheric particles? • How much atmosphere has escaped over history? • How important have the ‘ups’ been? • What can Mars teach us about other planets?
The Solar Wind Removes Atmosphere Mars lacks a global magnetic field like the Earth Mars Computer Simulation Mars Cartoon
Upper Atmosphere and Interplanetary Space - A Coupled System
Total Loss Through Time NGIMS IUVS Ion outflow Solar wind pickup Sputtering Photochemical and Jeans escape Ion bulk escape History of Solar Activity Physical & Empirical Models Isotope Ratios
This image shows the size of MAVEN's initial orbit when it first arrived at Mars, and then its current orbit after carrying out four maneuvers. The current orbit is very close to MAVEN's final science mapping orbit.Credit: University of Colorado/NASA
Artist’s rendition of the MAVEN spacecraft in orbit around Mars, with all of the booms deployed and instruments turned on. For scale, the spacecraft is 37 feet in length from tip to tip of the solar panels and extensions.Credit: University of Colorado/NASA
Atomic hydrogen scattering ultraviolet sunlight in the upper atmosphere of Mars, imaged by MAVEN’s Imaging Ultraviolet Spectrograph. Hydrogen is produced by the breakdown of water, which was once abundant on Mars' surface. Hydrogen is light and weakly bound by gravity, so it extends far from the planet (indicated with a red circle) and can readily escape.Credit: University of Colorado; NASA
Atomic carbon scattering ultraviolet sunlight in the upper atmosphere of Mars, imaged by MAVEN’s Imaging Ultraviolet Spectrograph. Carbon is produced by the breakdown of carbon dioxide, a potent greenhouse gas thought to be abundant in Mars’ past. Mars is indicated with a red circle; sunlight is illuminating the planet from the right.Credit: University of Colorado; NASA
Atomic oxygen scattering ultraviolet sunlight in the upper atmosphere of Mars, imaged by MAVEN’s Imaging Ultraviolet Spectrograph. Atomic oxygen is produced by the breakdown of carbon dioxide and water. Most oxygen is trapped near the planet, (indicated with a red circle) but some extends high above the planet and shows that that Mars is losing the gas to space.Credit: University of Colorado; NASA
Three views of an escaping atmosphere, obtained by MAVEN’s Imaging Ultraviolet Spectrograph. By observing all of the products of water and carbon dioxide breakdown, MAVEN's remote sensing team can characterize the processes that drive atmospheric loss on Mars. These processes may have transformed the planet from an early Earthlike climate to the cold and dry climate of today.Credit: University of Colorado; NASA
The geographical distribution of ozone in the southern hemisphere of Mars, imaged by MAVEN’s Imaging Ultraviolet Spectrograph. On Mars, ozone is primarily destroyed by the combined action of water vapor and sunlight. The cold, dark conditions near the pole allow ozone to accumulate there.Credit: University of Colorado; NASA; LATMOS/CNES
This image shows the sequence of events leading up to the first SEP event observed my MAVEN at Mars. The top panel shows the distance between MAVEN and Mars as a function of time. The bottom Panel show Energetic Ion Flux as a function of particle energy (vertical axis) and time (horizontal axis).Credit: Davin Larson
Coronagraph image taken by SOHO spacecraft from near Earth. From this this view angle the CME is heading to the left towards Mars.Credit: ESA/NASA SOHO
Coronagraph image taken by STEREO spacecraft with is currently situated on the far side of the Sun. From this this view angle the CME is heading to the right towards Mars.Credit: NASA STEREO Mission
This video shows the evolution of the Sept. 26, 2014, coronal mass ejection shock front as it propagates toward Mars as generated by the WSA-Cone-ENLIL model simulations performed at the NASA Community Coordinated Modeling Center. The color map represents the density of the solar wind plasma in the inner heliosphere from near the sun out to twice the distance of Earth's orbit.Credit: NASA's Goddard Space Flight Center
Comet C/2013 A1 Siding Spring (image by Hubble Space Telescope)
Education & Outreach Resources • MAVEN Educator Ambassador (MEA) project lessons and interactives http://lasp.colorado.edu/home/maven/education-outreach/for-educators/mea/ • Red Planet: Read, Write, Explore! lessons http://lasp.colorado.edu/home/maven/education-outreach/for-educators/red-planet • Invisible Mars: Science on a Sphere script & playlist http://lasp.colorado.edu/home/maven/education-outreach/afterschoolsummer-programs/invisible-mars • You can also share our MAVEN2Mars Twitter, Facebook, and YouTube links, if your audience would like to stay up-to-date on mission news: • https://twitter.com/MAVEN2Mars • https://www.facebook.com/MAVEN2Mars • https://www.youtube.com/user/MAVEN2Mars http://www.nasa.gov/mavenhttp://lasp.colorado.edu/home/maven