Download
1 / 21
210 likes | 231 Views
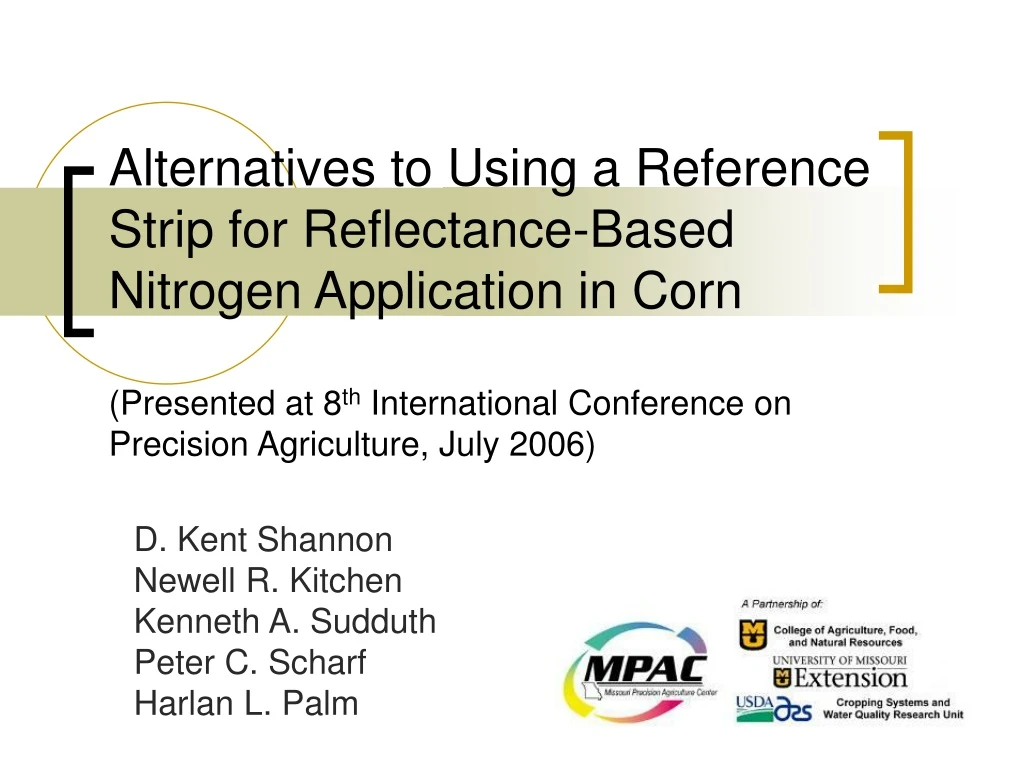
Alternatives to Using a Reference Strip for Reflectance-Based Nitrogen Application in Corn (Presented at 8 th International Conference on Precision Agriculture, July 2006). D. Kent Shannon Newell R. Kitchen Kenneth A. Sudduth Peter C. Scharf Harlan L. Palm. Alternative Approaches.

E N D
Alternatives to Using a Reference Strip for Reflectance-Based Nitrogen Application in Corn(Presented at 8th International Conference on Precision Agriculture, July 2006) D. Kent Shannon Newell R. Kitchen Kenneth A. Sudduth Peter C. Scharf Harlan L. Palm
Alternative Approaches • Small Sample Area • One Field Length Strip • Multiple Field Length Strips – Interpolated into a Reference Map • Using Soil Electrical Conductivity (EC)
Missouri Corn N Algorithm Ratio Reference≤ 0.25 60 ≤ N Rec ≤ 210
Small Sample Area Ratio = 0.2141
One Field Length Strip Ratio = 0.2736
Using Soil EC y = 0.0017x + 0.1838 R2 = 0.5348 C Site
C Site – N RecUsing Ceiling Ratio Value of 0.25 and Minimum N Rate of 60 lbs/acre Sample – R2 = 0.79 One Strip – R2 = 0.94 Multiple Strips Using EC – R2 = 0.94
W Site - N RecUsing Ceiling Ratio Value of 0.25 and Minimum N Rate of 60 lbs/acre One Strip – R2 = 0.26 Multiple Strips Using EC – R2 = 0.35 Sample – R2 = 0.25
Comparison of Sites – R2 Ceiling and 60 min
Comparison of Sites –Mean Nitrogen Rate in lbs/acre Ceiling and 60 min
W Site – N RecCeiling Ratio Value of 0.25 and Minimum N Rate of 60 lbs/acre * Ceiling Ratio Value of 0.25 Used Using a Sample at the Beginning of Each Strip
Conclusions • Spatial reference information is important for some fields. • A sample reference is sufficient in some cases, but the location of the reference can be critical. • We need to be able to determine where spatial information is most important.
W Site - N RecUsing Ceiling Ratio Value of 0.25 and Minimum N Rate of 60 lbs/acre One Strip – R2 = 0.31 Multiple Strips Using EC – R2 = 0.35 Sample – R2 = 0.30
Comparison of Sites – Standard Deviation Ceiling and 60 min River Bottom Fields