Insulating You, Insulating Earth
150 likes | 166 Views
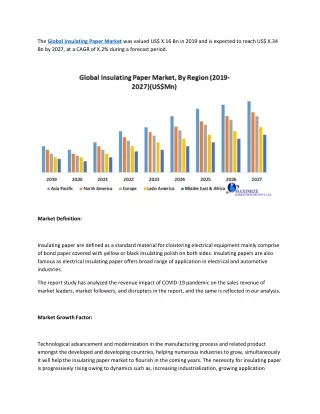
Explore the impact of rising carbon dioxide levels on Earth's climate through historical data and projections. Learn about greenhouse gases, human emissions, and the correlation between CO2 concentrations and global temperatures. Take action as a Climate Champion!

Insulating You, Insulating Earth
E N D
Presentation Transcript
Insulating You, Insulating Earth New Mexico Climate Champions
CO2 in the Atmosphere This graph shows the concentration of carbon dioxide in the atmosphere as measured at Mauna Loa since 1958. As you can see in the graph, atmospheric CO2 has been increasing steadily since measurements began. Source: www.esrl.noaa.gov/gmd/ccgg/trends/
Team Member roles • Test Subject • Materials Manager • Timer • Data Recorder
Greenhouse Gases Gases that trap thermal energy in the atmosphere • Carbon Dioxide • Water Vapor • Ozone • Methane • Nitrous Oxide • Fluorinated Gases Source: www.epa.gov/climatechange/ghgemissions/gases.html
This pie chart shows the percentage of each of the greenhouse gases that humans emit through our activities. Carbon dioxide accounts for more than 75% of the greenhouse gases that we release. Humans & Greenhouse Gases • Humans produce more carbon dioxide (CO2) than any other greenhouse gas Global Greenhouse Gas Emissions by Gas Source: www.epa.gov/climatechange/ghgemissions/global.html
Humans emit carbon dioxide mostly through fossil fuel combustion, i.e. the burning of coal, natural gas, and oil, for the production of electricity and transportation. How do humans release CO2? • Electricity • Largest source of CO2 emissions in U.S. • Transportation • Industry U.S. Carbon Dioxide Emissions, By Source Source: www.epa.gov/climatechange/ghgemissions/gases/co2.html
Climate • Description of the long-term pattern of weather in a particular area • Today’s (or even this month’s or this year’s) weather is NOT the same as climate Source: www.nasa.gov/mission_pages/noaa-n/climate/climate_weather.html
Climate Change Refers to any significant change in the measures of climate lasting for an extended period of time • Global warming • Temperature increasing • Precipitation patterns • More severe storms Source: www.epa.gov/climatechange/basics/
Recorded Data Since 1880 Global Warming This graph shows the temperature anomaly, or temperature change, globally since 1800 when scientists began reliably collecting global temperature data.
Atmospheric CO2 and Temperature: What is the Relationship? Top: Carbon dioxide concentration in the atmosphere has been increasing steadily since 1900. Bottom: Temperatures have also been increasing steadily during this timeframe.
Extension: Global Temperature Projections The graph shows the average of a set of temperature simulations for the 20th century (black line), followed by projected temperatures for the 21st century based on a range of emissions scenarios (colored lines). The shaded areas around each line indicate the statistical spread (one standard deviation) provided by individual model runs. Source: www.climate.gov/news-features/understanding-climate/climate-change-global-temperature-projections