Theoretical Applications
Theoretical Applications. SOIL 5813 Soil-Plant Nutrient Cycling and Environmental Quality Department of Plant and Soil Sciences Oklahoma State University Stillwater, OK 74078 email: wrr@mail.pss.okstate.edu Tel: (405) 744-6414.


Theoretical Applications
E N D
Presentation Transcript
Theoretical Applications SOIL 5813 Soil-Plant Nutrient Cycling and Environmental Quality Department of Plant and Soil Sciences Oklahoma State University Stillwater, OK 74078 email: wrr@mail.pss.okstate.edu Tel: (405) 744-6414
Liebig's law of the minimum (1862)Arnon & Stout Criteria for an essential element (1939) Bray's Nutrient Mobility ConceptSufficiency (SLAN)MitscherlichBray modified MitscherlichBase Cation Saturation Ratio Liebig's law of the minimum (Justus von Liebig 1803-1873) He stated that the nutrient present in least relative amount is the limiting nutrient. soil contained enough N to produce 50 bu/ac soil contained enough K to produce 70 bu/ac soil contained enough P to produce 60 bu/ac N would be the limiting nutrient. Crop used up all of the deficient nutrient in the soil making the yield directly proportional to the amount of the deficient nutrient present and the crop content of the nutrient.
From Tisdale, Nelson, Beaton (1985) Justus von Liebig (1803-1873), a German chemist, very effectively deposed the humus myth. The presentation of his paper at a prominent scientific meeting jarred the conservative thinkers of the day to such an extent that only a few scientists since that time have dared to suggest that the carbon contained in plants comes from any source other than carbon dioxide. Liebig made the following statements: 1 .Most of the carbon in plants comes from the carbon dioxide of the atmosphere. 2. Hydrogen and oxygen come from water. 3. The alkaline metals are needed for the neutralization of acids formed by plants as a result of their metabolic activities. 4. Phosphates are necessary for seed formation. 5. Plants absorb everything indiscriminately from the soil but excrete from their roots those materials that are nonessential. Not all of Liebig's ideas, were correct. He thought that acetic acid was excreted by the roots. He also believed that NH4+ -N was the N form absorbed and that plants might obtain this compound from soil, manure, or air. Liebig believed that by analyzing the plant and studying the elements it contained, one could formulate a set of fertilizer recommendations based on these analyses. It was also his opinion that the growth of plants was proportional to the amount of mineral substances available in the fertilizer. The law of the minimum stated by Liebig in 1862 is a simple but logical guide for predicting crop response to fertilization. This law states that “every field contains a maximum of one or more and a minimum of one or more nutrients. With this minimum, be it lime, potash, nitrogen, phosphoric acid, magnesia or any other nutrient, the yields stand in direct relation. It is the factor that governs and controls ... yields. Should this minimum be lime... yield ... will remain the same and be no greater even though the amount of potash, silica, phosphoric acid, etc.... be increased a hundred fold. “ Liebig's law of the minimum dominated the thinking of agricultural workers for a long time thereafter and it has been of universal importance in soil fertility management. Liebig manufactured a fertilizer based on his ideas of plant nutrition. The formulation of the mixture was perfectly sound, but he made the mistake of fusing the phosphate and potash salts with lime. As a result, the fertilizer was a complete failure. Nonetheless, the contributions that Liebig made to the advancement of agriculture were monumental, and he is perhaps quite rightly recognized as the father of agricultural chemistry. Following on the heels of Liebig's now famous paper was the establishment in 1843 of an agricultural experiment station at Rothamsted, England. The founders of this institution were J. B. Lawes and J. H. Gilbert.
Arnon’s Criteria of Essentiality link • Element required to complete life cycle • Deficiency can only be corrected by the ion in question • Element needs to be directly involved in the nutrition of the plant and not indirectly via the need of another organism.
Sufficiency: SLAN (Sufficiency Levels of Available Nutrients) • Range of nutrient (insufficient to sufficient) • Amount extracted from the soil is inversely proportional to yield increases from added nutrients. • Calibrations exist for the changing levels of available nutrients with fertilizer additions and yield response. • Concept assumes little if any effect of the level of availability of one ion on that of another. • Recognizes that an addition of the most limiting element may cause more efficient utilization of a less limiting element.
Mathematical expression of the law of diminishing returns where increases in yield of a crop per unit of available nutrient decreases as the level of available nutrient approaches sufficiency. The concept is based on Mitscherlich's equation: dy/dx = (A-y)c Yield increases (dy) per unit of available nutrient (dx) decrease as the current yield (y) approaches a maximum yield (A) with c being a proportionality constant. The derivative was developed for studying tangent lines and rate of change. The first derivative is the slope of the tangent line at xo d/dx xn = nxn-1 Quadratic: Y = bo + b1x - b2x2 0 = b1-2b2x 2b2x = b1 x=b1/-2b2 y Y = bo - b1x + b2x2 x
Plant Response to Soil Fertility as Described by the Percent Sufficiency and the Mobility Concept Plants respond to the total amountof mobile nutrients present Plants respond to the concentration of immobile nutrients present Yield is proportional to the total amount of mobile nutrient present in the soil. Yield response to immobile nutrients is not related to the total amount of the “available form” present in the soil, but instead is a function of the concentration of available form at, or very near, the root surface. Response of crops to mobile nutrients should be linear because mobile nutrients (like water) are not decreased in availability by reaction with the soil. The linear response to mobile nutrients continues with each added increment of nutrient until yield potential for that growing environment has been reached, after which it is zero (see figure below)
Reaction of mobile nutrients with soil is minimal. “rules of thumb” have been developed to guide the use of mobile nutrients like nitrogen, such as “it takes 2 lbs N/bushel of wheat”. Where did this come from? (Groups)
Reaction of mobile nutrients with soil is minimal. “rules of thumb” have been developed to guide the use of mobile nutrients like nitrogen, such as “it takes 2 lbs N/bushel of wheat”. 2 lbs is calculated from the protein or N content (on average) of a bushel of wheat, with the added assumption that measured soil nitrate-N and added fertilizer N will be only 70% utilized. 13.28% protein / 5.7 = 2.33%N * 60 lbs/bu = 1.4 lb N/bu 1.4/0.70 = 2.0 lb N/bu 0.70??? Keeney, 1982 (50% of the N in the grain comes from the soil and rainfall) 0.35 and 0.35? Ma et al. (1999) found that the amount of net N mineralized over a growing season accounted for ½ the plant N uptake for all of the treatments in the experiment.
Bray’s mobility concept: If available N is limited to level below maximum yield potential then a yield plateau will occur at that point. • Example • enough N to produce 20 bu • midway through the season better than average weather conditions result in increasing the yield potential to 30 bu • mobility concept implies the yield will be limited to 20 bu. because the total supply of nutrient will be used up to produce 20 bu • additional yield can only be obtained if more of the nutrient is added (reason for topdressing wheat midway through the season). • In-SEASON use of the mobility CONCEPT (sensors-NDVI?) …….
For immobile nutrients, like P, plants can only extract soil nutrients close to the root surface Very little of the nutrient is moved to the root by water in the transpiration stream because soil solution concentrations are small (< 0.05 ppm for phosphate compared to as high as 100 ppm for nitrate-N). As a plant grows and roots extend out into the soil, roots come in contact with “new” soil from which they can extract phosphate. The amount extracted is limited by the concentration at (or very near) the root-soil interface. If the concentration of phosphate available to the plant at the root -soil interface is inadequate to meet the needs of the plant, then the plant will be deficient in P throughout its development. “contact exchange”“mass flow”“diffusion” The deficiency will always be present, and plant growth and crop yield will be limited by the degree to which the immobile nutrient is deficient. Another, perhaps more common way of expressing this nutrient limitation is to state that yield will be obtained according to the sufficiency of the nutrient supply
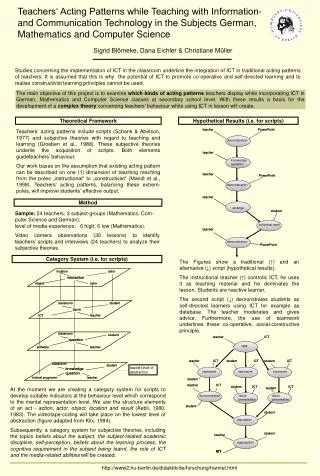
Bray’s Mobility Concept (mobile nutrients)? Perkins, Feekes 4, 1997
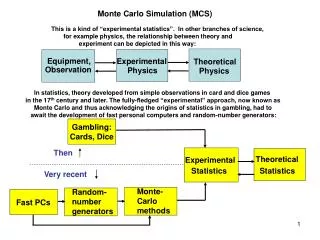
Bray’s Mobility Concept (immobile nutrients)? RS=30.5 Biomass RS=15.2 P Rate What would this graph look like for immobile nutrients (consistent with the mobility concept)?
When the nutrient limitation is expressed as a percentage of the potential yield then the term percent sufficiency may be applied. When percent sufficiency <100, plant performance < potential yield provided by the growing environment. Does not matter whether potential yield is 20 bu. or 30 bu., if the percent sufficiency is 80, then actual yield obtained (theoretically) will only be 80% of the potential yield. Soil test for mobile nutrients: indicator of the total amount available If soil test N is enough to produce 20 bu/ac, more N would have to be added to the total pool to produce 40 bu/ac. With P, an index is developed that is independent of the environment. If the crop year was good, roots would expand into more volume of soil that had the same level of nutrient supply. Sufficiency is independent of the environment since increased root growth will expand into areas where contact exchange uptake is the same (total amount present in the soil is not greatly affected).
Mobile Immobile Concept yield goal sufficiency Environment dependent independent Sorption Zone root system root surface Influence of crop uptake on total available large small Soil test is an indicator of the total available yes no Soil solution concentrations 0-100 ug/g <0.05 ug/g Function of conc. in the root syst. conc. at the root surf. Topdress appl. Yes No ___________________________________________________
Example: Wheat (4081 kg/ha = 60 bu/ac) 2.5%N in the grain =102.03 kg N (4081 kg/ha = 60 bu/ac) 0.36%P in the grain =14.69 kg P Soil 0.1% N*10000=1000 ug/g * 1.47 * 1.524 = 2240 kg N/ha 0-15 cm NO3-N: 10 ug/g * 1.47 * 1.524 = 22.40 kg NO3-N/ha 0-15 cm NO3-N soil test is the actual N available at time X NO3-N soil test is valid for one point in time (1 crop or year) Some states predict N mineralization 0.1% P*10000=1000 ug/g * 1.47 * 1.524 = 2240 kg P/ha 0-15 cm P soil test is an index (sufficiency) of availability P soil test is valid for up to 5 years or more** 10 ug/g P, Mehlich III is not equal to 22.40 kg P/ha We cannot predict P mineralization (102.03/2240)*100 = 4.5% (14.69/2240)*100 = 0.65%
Steps for Using the Sufficiency Concept: 1.Selection or determination of the sufficiency level a. estimated from results of studies with a crop on similar soils 2.Computation of fertilizer required for sufficiency a. amount of soluble P required to raise the available P from the initial level to the sufficiency level. 3.Method of supplying the fertilizers (and/or lime) a. soil build-up plus crop needs (BUILD-UP) long-term b. crop needs (MAINTENANCE) short-term
Mitscherlich-Baule percent sufficiency concept: When more than one nutrient was deficient, the final percent sufficiency is the product of the individual sufficiencies. _____________________________________________________ Maximum yield when N,P and K are present in sufficient quantities 5000 kg/ha Yield when N and P are present in sufficient quantities 4000 kg/ha 4000/5000 = 80% of Max Yield when N and K are present in sufficient quantities 3000 kg/ha 3000/5000 = 60% of Max _____________________________________________________ What will be the predicted yield when only N is present in sufficient quantities 2400 kg/ha 5000(0.6 * 0.8) _____________________________________________________ "present" function of both soil levels and amount applied. If this percent sufficiency concept is correct, then Liebig's concept of the limiting nutrient is wrong.
Sufficiency Calculations ________________________________________________________________ Present Field X Field Y * Field Z * in adequate Yield kg/ha amounts NP 6400 9600 8000 12000*.8 NPK 8000 12000 10000 8000/.8 NK 7200 108009000 12000*.9 10000*.9 PK 7000 70007000 ________________________________________________________________ N 5760 8640 7200 8000*.8*.9 12000*.8*.9 10000*.8*.9 % sufficiency K NP/NPK = 6400/8000 = 0.8 % sufficiency P NK/NPK = 7200/8000 = 0.9 * - assume that the % sufficiency levels for P and K are the same in field Y and field Z
Leibig's law of the minimum: correct for mobile nutrients Mitscherlich: correct for immobile nutrients. Example: Soil 1: RSSZ has 20 lbs of N/acre and 5 lbs of S/acre Soil 2: RSSZ has 20 lbs of N/acre and 10 lbs of S/acre Crop grown will contain 1.0%N and 0.1%SN in both cases is enough for a yield of 2000 lbs/acre. In Soil 1, S is adequate for a yield of 5000 lbs /acre In Soil 2, S is adequate for a yield of 10000 lbs/acre A = (yield possibility) for Soil 1 A = 5000, for Soil 2 A = 10000 If % sufficiency governs yield, Y1/A1 = Y2/A2 2000/5000 does not equal 2000/10000
Mitscherlich: correct for immobile nutrients. Mitscherlich (growth function for soil test correlation studies) log (A-y) = log A - cx A = yield possibility when all nutrients are present in adequate amounts but not in excess y = yield obtained at a given level of x (dy = dx) and when y is always less than A(99%) c = proportionality constant NOTE: some texts use c and others c1, however, it does not matter which one is used, so long as they are defined. Similarly, b and x are used interchangeably Mitscherlich showed that response of plants to nutrients in the soil can be expressed by a curvilinear function and a logarithmic equation Concluded that the regression coefficient c in the equation was constant for each nutrient regardless of any change in environment, plant type, soil and other factors (Balba and Bray, 1956). Mitscherlich was incorrect in his use of c values for N 0.122, P=0.60 and K = 0.40. When the value of c is small a large quantity is needed and visa versa.
dy dy ---- = c(A-y) and ----- = dxc dx (A-y) log(A-y) = log A – cx (Melsted & Peck use b instead of c) * A and y can be expressed as actual yield or % of the maximum yield STEP 1. Experimental locations with different soil test P (b) levels NPK NK Sufficiency x calc. c Loc 1 30 20 0.66 12 1.53=2-12c 0.039Loc 2 40 15 0.375 4 1.79=2-4c 0.051Loc 3 30 16 0.53 9 1.67=2-9c 0.036 avg. 0.042 A=100y = 66x = 12 log(100-66) = log 100-12c1.53 = 2 - 12c12c=0.47c= 0.039
STEP 2. Apply value of c where applicable. If the soil pH or soil test K changes over an area, then c has to be altered accordingly. Now that an average c factor has been determined, we can relate the soil test level of b with yield sufficiency for this element. (CAN determine % SUFFICIENCY)
STEP 3. (Bray Modified Mitscherlich) Expand Mitscherlich to calculate amount of fertilizer to raise percent yield from any given starting level to any other desired upper level for which fertilization is desired Log(A-y) = log A - cb - c1x c1 = efficiency factor for the method of applying the fertilizer (determined from fertilizer studies). This factor will change accordingly for immobile nutrients (band versus broadcast) x = quantity of fertilizer that needs to be applied. STEP 4. Fertilizer studies c1 (broadcast P) = 0.0070 c1 (banded P) = 0.0025
c and c1 vary with 1. crop 2. planting density/pattern 3. nutrient applied (source) 4. method of application 5. management 6. soil Yield Possibility 1. soil 2. climate, moisture 3. yield potential (hybrid) 4. planting density and pattern Soil Nutrient Requirement (level determined) 1. when sampled 2. stage of growth 3. crop 4. form of nutrient applied 5. analytical method Fertilizer Requirement (x) 1. b 2. fertilizer used 3. crop 4. placement
Bray Modified Mitscherlich Log (A-y) = Log A - cb - c1xA = maximum yield y = yield obtained at some level of bb = soil test index c = efficiency factor (constant) for bx = amount of fertilizer added to the soil c1 = efficiency factor for x (method of placement) Example: Soil test value for P = 20; N, K and all other nutrients adequate kg P/ha Yield, kg/ha % Sufficiency0 2000 40 25 3000 60 50 4500 90 75 5000 100 log (100-40) = log 100 - c(20)1.778 = 2.00 - c(20)-0.2218 = -c(20)c = 0.01109solve for c log (5000 - 3000) = log 5000 - 0.01109(20) - c1(25)3.301 = 3.477 - c1(25)c1 = 0.00704 log (5000 - 4500) = log 5000 - 0.01109(20) - c1(50)2.6989 = 3.477 - c1(50)c1 = 0.0155 average of c1 = (0.00704 + 0.0155)/2= 0.011303
STEP 5: Apply concept (solve for x, determine the amount of fertilizer to be applied)Log (A-y) = log A - cb - c1x *The dangers of using % yield: It is difficult to determine amounts of fertilizer to add (e.g., 2.0 Mg/ha yield and 4.0 Mg/ha yield) Assumes that reliable soil test data is available for good soil test correlation
Review of Methods to Determine Critical Levels Quadratic Square Root Cate-Nelson Linear-plateau Mitscherlich
Cate and Nelson (1965) % yield versus soil test level Two Groups:1. probability of response to added fertilizer is small2. probability of response to added fertilizer is large A.Percent yield values obtained for a wide range in locations (fertilizer rate studies) Percent yield = yield at 0 level of a nutrient / yield where all factors are adequate B. Soil test values obtained (Check Plot) Will generate a single % yield and one soil test value for each location C. Scatter diagram, % yield (Y axis) versus soil test level (x axis) Range in Y = 0 to 100% D. Overlay -overlay moved to the point where data in the +/+ quadrants are at a maximum -point where vertical line crosses the x = critical soil test level
Critcal level depends on the extraction method used and crop being grown. • Cate-Nelson: Maximizes the computed chi-square value representing the test of the null hypothesis that the # of observations in each of the four cells (quadrants is equal). • 2. Mitscherlich • 3. Quadratic • Square Root • Linear Plateau: obtaining the smallest pooled residuals over two linear regressions. • Equation MR MER (dy/dx = PR) • ________________________________________________________________________________ • 2. Mitscherlich Log(A-Y) = Log A - C1(x+b) x=log((2.3*A*c)/PR)/c-b • 3. Quadratic y = b0 + b1(x) - b2(x2) x=0.5 b1/b2 x=(PR-b1)/(2*b2) • 4. Square Root y = bo + b1(x) + b2(sqrt(x)) x=0.25(b2/b1)2 x=(b2/ 2*(PR-b1))2 • 5. Linear Plateau y = bo + b1(x) when x < joint • y = bo + b1(joint) when x > joint • ________________________________________________________________________________
Use of Price Ratios PR = (price per unit fertilizer) / (price per unit yield) Optimum rate of fertilizer capable of generating the maximum economic yield is dependent upon the price of fertilizer, the value of the crop and magnitude of fixed production costs. The value of a crop defined as a function of yield and rate of fertilizer can be expressed as: V = Y * Py = F(x) * Py where yield (Y) for each fertilizer rate is multiplied by the crop price (Py) per unit of yield. A line describing fertilizer costs per unit area cultivated can be expressed as a function of fixed costs (F) and fertilizer price (Px) times the amount of fertilizer (X) T = F + Px * X where total cost (T) is a linear function of fertilizer amount, the slope of the line is given by the price of fertilizer and the intercept by the amount of fixed costs involved (F).
A plot of the value and cost functions illustrates the areas where use of fertilizer is profitable. Net profit can only be generated by use of a fertilizer amount equal or greater than 0-x1. Fertilizer should not be used if the value curve is lower throughout than the total cost curve for fertilizer plus fixed costs (F). With fixed costs involved, the amount of fertilizer that can be used profitably is greater than zero or an amount equal to or greater than 0-x1. For fertilizer input greater than 0-x1, crop value exceeds costs and net profit is generated. Profit from fertilizer application can be increased until input reaches the value of 0-x2. This is the level which maximizes profit. At 0-x2 the difference between value and cost is at a maximum. For each production function the amount of fertilizer which maximizes profit can be found by obtaining the first derivative and setting it equal to the price ratio (PR). PR = Price per unit of fertilizer / Price per unit of yield (from Barreto and Westerman, 1985)
Base Cation Saturation Ratio For optimum growth of crops, both a best ratio of basic cations and a best total base saturation exist in a soil. Bear et al. (1945) New Jersey, Rutgers Percent saturation of cations selected as being "ideal". Work originally conducted on alfalfa. Historically, it is interesting to note that this work was being done at the same time Bray developed the mobility concept. Ca 65%Mg 10% (minimum required for alfalfa)K 5%H 20% Ca:Mg > 6.5:1Ca:K > 13:1Mg:K > 2:1
Bear et al. (1945) suggested that1.10% Mg saturation was minimal for alfalfa2.Soluble Mg sources were essential for correcting Mg deficiencies in sandy soils3.Liming above 80% base saturation (20% H) brought about deficiencies of Mn and other micronutrients.Graham (1959) established ranges or % saturation of the CEC for the 'ideal' soilCa: 65-85Mg: 6-12K: 2-5H: ? When this proportion exists, you can obtain maximum yield. Works well in highly weathered soils of low pH requiring major adjustments in fertility. Arizona, pH 8, 100% calcium saturatedCentral America, Andisol
Principles Involved: • Bonding of cations to exchange sites differs greatly from one cation to another and differs greatly for the same type of cation at different saturations. • Exchangeable cations are not proportional to soluble amounts (plant available) • Excess of one cation may depress the activity and plant uptake of another • Adsorbed ion (x) can have marked effects on the ion in question • Capacity (total exchangeable) and intensity (activity) of an adsorbed cation influence the total availability of a cation to the plant • Saturation of pH-dependent charges increases the activity and plant availability of divalent basic cations • Dilution of the soil solution concentration, favors adsorption of highly charged cations onto the soils • We need K, Mg, Ca…. But do we need ratios?
Steps in USING BCSR: • Soil analyzed for exchangeable bases • Lime requirement to raise the soil pH to X (6.5) • CEC is determined by adding basic cations + acidity (exchangeable H and Al), each expressed as meq/100g or cmol/kg • Each basic cation expressed as a % of the total CEC • Cations must be added to the extent that the existing saturations of basic cations = ranges chosen (e.g., some must decrease and others must increase)
Base Cation Saturation Ratio Works well on low to moderate CEC soils and coarse textured soils, highly weathered soils of low pH that require major adjustments in fertility. Useful where it is important to maintain a fairly high level of Mg in the soil to alleviate grass tetany in ruminants. Grass tetany (low concentrations of Mg and Ca in cool-season grasses in late fall and early spring). Grass tetany will occur when forage contains K/(Ca+Mg) > 2.2 (physiological nutrient imbalance which leads to muscle spasms and deficient parathyroid secretion) If McLean refuted his own work in 1984 at the annual ASA meetings (shortly before he died), why are we still teaching this concept? Harris Labs?
Fried and Dean (1951)Assuming that plants take up nutrients from two different sources in direct proportion to the amount available, the A-value was developed as the expressionA = B(1-y)/y where; A = amount available nutrient in the soilB = amount of fertilizer nutrient (standard) applied y = proportion of nutrient in the plant derived from the standard “Lower A values = Higher P Availability”
"In a true sense, the plant is the only agent that can determine the amount available." For specific soil, crop and growing conditions: A-value is constant independent of rate of fertilizer application independent of size of test pot and growth rate A value developed to determine availability of P in soil (P supplying power of a given soil). Band placement: A values increased with increasing P rates, which suggests that availability to plants when P was banded does not remain constant with increasing rates. Because it can be assumed that method of placement does not change the soil phosphorus, lower A values with the band placement can be attributed to a higher availability of the standard (nutrient applied) (Tables 2 and 3) Fertilizer recovery by plants was independent of the rate of application for the mixed application, but decreases with the rate of application for the band placement (Table 3).