Download
1 / 18
180 likes | 266 Views
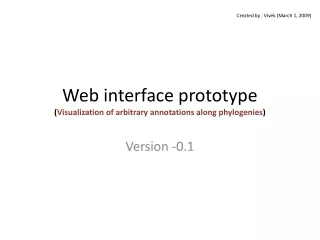
A Web Interface to analyse SOM of Bipartitions of Gene Phylogenies - A Walk Through. J. Peter Gogarten, Maria Poptsova Dept. of Molecular and Cell Biology University of Connecticut Neha Nahar, Lutz Hamel Department of Computer Science and Statistics University of Rhode Island. BranchClust.

E N D
A Web Interface to analyse SOM of Bipartitions of Gene Phylogenies - A Walk Through J. Peter Gogarten, Maria Poptsova Dept. of Molecular and Cell BiologyUniversity of Connecticut Neha Nahar, Lutz Hamel Department of Computer Science and Statistics University of Rhode Island
BranchClust n Genomes Super Families Gene Families Reconstruct Phylogenetic History for Each Family
Data Matrix Number of bipartitions (k) for N genomes is equal to 2(N-1)-N-1.
Visualizing Multiple Genomes: SOMs • SOM Self-Organizing Map • An artificial neural network approach to clustering • we are looking for clusters of genes which favor certain tree topologies • Advantages over other clustering approaches: • No a priori knowledge of how many clusters to expect • Explicit summary of commonalities and differences between clusters • Visually appealing representation T. Kohonen, Self-organizing maps, 3rd ed. Berlin ; New York: Springer, 2001.
All clusters selected => ATV tree viewer applet (Zmasek & Eddy, Bioinformatics, 17, 383-384 2001) displays plurality consensus of all gene families. ATV allows to modify display
Select branch to place root Select to re-root tree
Euryarchaeota Root Cren-archaeota
List of strongly supported bipartitions, including conflicts
“well behaved” gene families select clusters that support bipartition
prolyl-tRNA synthetase, a gene family that groups the Halobacteria with the outgroup. This gene was acquired by the halobacterial lineage from the bacteria. These rare inter-domain gene transfers allow to correlate evolution in the three domains of life. (see Huang & Gogarten: Ancient horizontal gene transfer can benefit phylogenetic reconstruction. Trends in Genetics 22 (7): 361-366. 2006)