Download
1 / 40
400 likes | 412 Views
This study presents a new methodological approach to identify metropolitan regions in Europe based on functional specialization rather than territorial units. It analyzes the concentration of metropolitan functions in different areas and their contribution to European territorial development. The study covers the whole European territory and uses reliable unofficial statistical data. The results show that 7% of municipalities in Europe have metropolitan functions, with the top 480 representing 78% of all metropolitan functions. The analysis highlights the importance of metropolitan areas in Europe's population, GDP, and overall development.

E N D
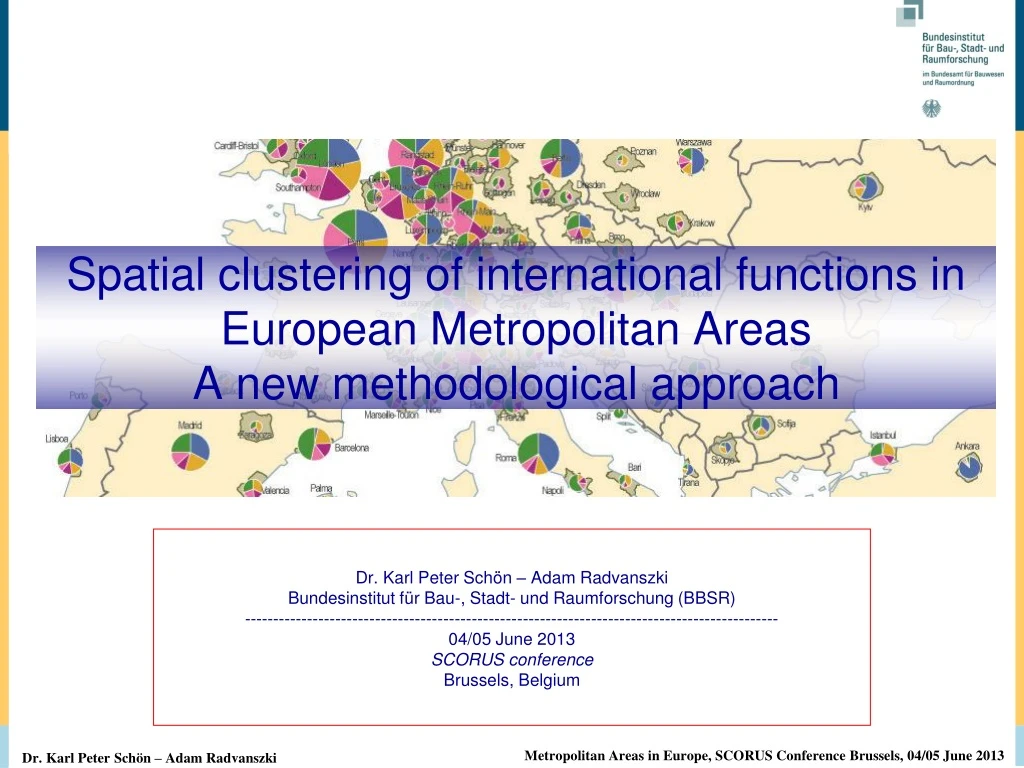
Dr. Karl Peter Schön – Adam Radvanszki Bundesinstitut für Bau-, Stadt- und Raumforschung (BBSR) ---------------------------------------------------------------------------------------------- 04/05 June 2013 SCORUS conference Brussels, Belgium Spatial clustering of international functions in European Metropolitan Areas A new methodological approach
How to identify metropolitan regions • The ‚classical‘ geographical approach: • Preselect administrative units with „urban“ characteristics • based on population size, density, or other morphological indicators • identify larger regional units (commuting areas, cont. build-up areas), • Then add indicators for metropolitan, international, global importance • And analyse to which degree urban areas are „metropolitan“, i.e. involved in global processes artefacts ? Does pop matter? Comparable data?
Alternative approach • Start from (global) functions rather than territorial units: • Modern societies are organised in subsystems which are based on functional specialisation (Luhmann). • Five important subsystems are: politics, economy, science, transport, culture. • All these subsystems are globalizing, building their own specific (spatial) patterns of networks. • Networks consist of nodes and edges. • Where are global functions located (the nodes)?
Reversed approach • Instead of asking: • „Where in Europe are the most significant concentrations of population („urban areas“) and what „metropolitan“ characteristics do these areas have?“ • we asked: • „Where in Europe are the most significant concentrations of metropolitan functions and how do they constitute a European pattern of „metropolitan areas“?“
Index of metropolitan functions • 5 functional areas • Politics, Economy, Science, Transport, Culture • 16 group of indicators • 38 indicators • The 38 normalised indicators are additively combined to 16 groups of indicators, these to an index for each functional area, these again combined to a summary index of metropolitan function
Requirements for the indicators • All 38 indicators meet the following requirements: • Cover the whole European territory (CoE) • Standard definition for all countries • Reliable unofficial statistical data • Exact geocoding of all data (LAU-2 or exact coordinates)
locations with metropolitan function • About 120.000 municipalities all across Europe form the territorial reference of the analysis • On a single indicator base, 8.480 units have any metropolitan function (= 7 %)
Concentration of metropolitan functions • Out of 120.000 municipalities in Europe (LAU-2 statistical units) • 8.480 (=7%) have any metropolitan function • The top 480 (MFI > 1) represent 78% of all MF • The top 184 (MFI > 3) represent 63% of all MF • On a country base: • Germany = 16% • UK =12% • France = 10% • Italy = 8% • Spain = 6% • These 5 together: 52% • … and the Pentagon: ~ 50%
Concentration of metropolitan functions • MFI index points per 1 Mio population: • Luxembourg = 55 • Switzerland =17 • Sweden = 14 • Belgium = 12 • Norway = 12 • Denmark, Austria, Netherlands = 10 (each)
Some characteristics • These resulting 125 metropolitan regions • Account for 10% of the total area • Concentrate 50% of Europe‘s population (=350 mio inh.) • And 65% of Europe‘s GDP (=8.500 bn €) • And 80% of all metropolitan functions
http://www.bbsr.bund.de/cln_032/nn_147528/BBSR/EN/Publications/OnlinePublications/2011/ON012011.htmlhttp://www.bbsr.bund.de/cln_032/nn_147528/BBSR/EN/Publications/OnlinePublications/2011/ON012011.html
Role of metropolitan areas in European territorial development Territorial development policy should be evidence based Territorial Agenda 2020 to support the territorial dimension in the implementation of the EU2020 Strategy Analysis to join policy goals with evidence Metropolitan areas in focus Follow-up of the study on functions of european metropolitan areas The role of metropolitan areas in european territorial development and their contribution to the EU2020 and TA2020 goals is investigated
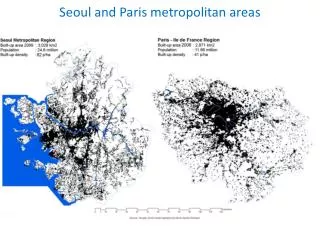
Functional metropolitan areas vs. NUTS Territorial scope: EU28 Differentiation Metropolitan areas: capital cities and other metropolitan areas Non-metropolitan areas: „metropole-marginal“ areas and peripheries Old and new EU member states Methodological challenge: Availability of regional data Recalculation from NUTS to functional metropolitan areas Method applied: data weighed with the proportion of metropolitan population within the NUTS region, based on LAU2 level
Uneven concentration of population Capital cities have a similar weight in EU13 and EU15 (20%) In EU15 more cities can show up a bundle of metropolitan functions (48% of population) • Only 5 cities can reach the benchmark of metropolitan functions in EU 13 (less than 9%) • High concentration in capitals in small countries
Ageing in general, but in different patterns Youth: Slight differences between EU15 and EU13 in the proportion Difference in the direction of change: in EU13 proportion of youth slightly increases with peripheriality, in EU15 vice versa Old: Substantially more elderly in EU15 Clear tendency in EU15 : proportion of elderly increases with peripheriality
Peripheries have high poverty rate Methodological problems with measuring poverty Who is poor? On what territorial level is information available? Peripheries tend to have higher poverty rates Gap between metropolitan areas and paripheries is wider in EU13 Capital cities in EU13 have higher poverty rates than other metropolitan areas
Metropolitan areas of large countries are the engines of the EU High concentration of economic output in metropolitan regions Capital cities have a high share of output in EU13 Peripheries have a dominant role in some new member states Absolute values of GDP show where the real engines of the economy are
Differences in employment and productivity Capital cities have a similar weight in employment in the old and new member states Almost half of the employed in other metropolitan areas in old member states (less than 10% in new member states) One quarter of employment in peripheries, in new member states more than half Labour productivity: decreases with peripheriality, gap is wider in new member states
R&D concentration will cause further polarisation R&D is concentrated in the old member states (90%) in some countries in capital cities Risk of further polarisation on the long run Only a few areas have reached the EU2020 target
Environmental impacts are hard to measure Lack of regionalised data on 20/20/20 goals Rough estimations possible Most of the energy is used in the metropolitan areas of the old member states Peripheries account for a higher share of energy consumption in new member states Metropolitan areas seem to be more energy-efficient than peripheries
Observations for policy consideration The importance of metropolitan areas is different in different parts of Europe Capital city regions have a similar weight in the old and new member states, however it varies for each member state In the old member states, metropolitan regions have a substantial share, in new member states only a few cities can bundle metropolitan functions The importance of peripheries in the new member states is high, where small and medium sized towns can have a crucial role in development In most themes metropolitan areas are better off than peripheries Risk of polarisation: differences in ageing, R&D can lead to long term polarisation between more central and more peripheral regions
More to go… EU2020 performance of single metropolitan areas Employment R&D Tertiary education Poverty Early school leavers Energy consumption Greenhouse gas emission Renewable energy To explore better the differences among metropolitan areas in their possibility to contribute to the implementation of the EU2020 Strategy To better explore the role of metropolitan areas in the implementation of the common territorial priorities in the EU (TA2020)
Thank you for your attention! • peter.schoen@bbr.bund.de • adam.radvanszki@bbr.bund.de • www.bbr.bund.de > en > publications • -> BBSR-Berichte KOMPAKT 7/2010 • -> BBSR-Online-Publikation, Nr. 01/2011 • -> BBSR-Analysen KOMPAKT 2013 (forthcoming, in German)