Download
1 / 27
270 likes | 292 Views
Understand the impact of climate change on the economy, using General Circulation Models (GCMs) to analyze future climate projections. Learn about data needs, modeling concepts, and the cost of climate change adaptation.

E N D
The Economics of Climate Change and Adaptation Speaker: Jean-Marc Mayotte MA Water Resources Engineering University of Colorado and University of Copenhagen CIEM DANIDA Project
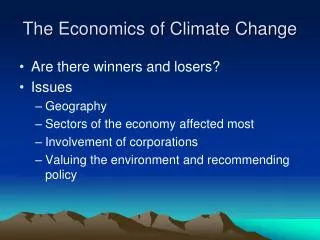
Talking Points • What is a GCM? • Accounting for future climate uncertainty • Linking climate to the economy • Data needs • Example: Mozambique • Concluding remarks NOTE: This presentation will concentrate on the framework and methodology within which the study is conducted. It will also only address the climate analysis and the climate’s interaction with the models within the framework leading up to the economic analysis. The CGE will not be discussed in detail.
General Circulation Model • A mathematical representation of the general circulation of the planetary atmosphere based on the Navier-Stokes equations • There are 22 GCMs officially recognized by the International Panel on Climate Change • Predictions of future climate are based on CO2 emission scenarios used to estimate the concentration of CO2 in the Earth’s atmosphere
Wide Variation at Local Scale between Models Precipitation 2100 NCAR Precipitation 2100 MIROC
Consistent Message from GCMs Change in Daily Precipitation Intensity Change in inter-storm arrival Seasonal & Spatial Variation
Selecting the Climate Change Scenarios • Not all GCMs are used in the analysis • Models are picked based on their predicted Climate Moisture Index (CMI) • Simple water balance that accounts for both precipitation and evaporation • The average CMI for the time-horizon (2000 – 2100) is predicted using each GCM. The models that predict the “wettest” and the “driest” CMI in the region considered are used in an effort to capture the “wettest” (+1) and “driest” (-1) possible futures
Adapt to what? – Global Wet and Dry Two extreme GCMs used to estimate range of costs
Modeling Concept CLIMATE CHANGE HUMAN ENVIRONMENT COST OF CLIMATE CHANGE ECONOMY
Uses of History • Simulations are based on historical experience • The impacts from future CC will likely resemble those from the current climate but with some modifications to their frequency, timing, and magnitude • These changes in the distribution require a new approach to “risk based” design (i.e. what used to be a 1/50 year storm may become a 1/25 year storm) • Models • The models used to relate CC to the economy are constructed based on underlying science and knowledge of technology/biology and tested, calibrated, and legitimized using historic climate data
Extensive Data Needs • The analysis is spatially and temporally dependant and the quality of its outputs are entirely reliant on the quality of its input data • Many global databases are available but locally collected and quality assured data increases the applicability and reliability of model outputs
Climatologic data Precipitation, min/max temperature, pressure, humidity Land cover and vegetation data Wetlands Agricultural land Commercial Residential Industrial Institutional DEM (Digital Elevation Map) data 10-30 m preferred Soil Slope Hydraulic conductivity Population Density maps Poverty maps Housing type Infrastructure Road inventory maps Bridge inventory Rail inventory Urban drainage Property value Hydropower production By province Tropical Storms/Cyclones Storm track Magnitude Rainfall Wind speed Storm surge Economic Data Manufacturing production values Crop production Data Needs NOTE: The project has already received significant support from the Institute of Mechanics, Remote Sensing and GIS, MONRE, and CIEM
Model Framework Climate Shocks Flood, Drought, Cyclone General Circulation Models (GCM) Temperature, Precipitation Rainfall Runoff Model Hydrologic Model Surface Water Surface Water Availability Transportation Model Coastal Infrastructure Agriculture Model Energy Production Model Damage Production Production Functionality COST OF CLIMATE CHANGE Comuputable General Equilibrium (CGE)
The Economics of the Adaptation to Climate Change (EACC) Mozambique Massachusetts Institute of Technology (MIT), University of Colorado, and University of Copenhagen Funded by the World Bank
How are Mozambique and Vietnam Similar? • Both are estuary countries and are strongly reliant on coastal infrastructure making them very vulnerable to sea level rise • Both have a large discrepancy between the rich and poor • Both exhibit rather significant economic growth and development but have done little to adapt to potential changes in climate • Agriculture is a very significant part of both economies and are very reliant on available surface water
Adapt to what?Mozambique Wet and Dry Precipitation in 2050 Moz. Dry (ukmo) Moz. Wet (ipsl) -3.6% : -30.6% -6.3% : 16.3% • Regional variation in precipitation continues to be significant between northern and southern Mozambique • The southern portion of the country is projected to either remain relatively similar or increase dramatically
Adapt to what?Mozambique Wet and Dry Temperature in 2050 Moz. Dry (ukmo) Moz. Wet (ipsl) 1.24o : 2.09o 1.15o : 1.75o • Regional variation in temperature is not as significant as precipitation variation • Both scenarios display a 1o – 2o increase in for Mozambique
EACC Mozambique Modeling Framework • Infrastructure • Roads • M&I Water • Floods
Agriculture Effects on yield in 2050 compared to historic averages NOTE: Further collaboration with INGC will provide more detailed geared at determining the vulnerability of individual crops to climate change Bars represent the average change in overall crop productivity. Regional averages are weighted by historic crop yield rates per crop in the region. Changes in crop productivity over all of Mozambique are net negative in all scenarios with central Mozambique being hit hardest suggesting that this region may be most vulnerable
RoadsCost of Maintaining Existing Road Inventory 2010 - 2050 Construction of new gravel and earth roads is not modeled. Only maintenance of existing gravel and earth roads. Costs however DO take into account making improvements to the existing roadstock that anticipate the climate change effect on paved roads. These numbers DO NOT include the modeling of flood shocks The initial investment in paved roads is high but maintenance costs are dramatically reduced as roads are built more climate resilient
HydropowerAnnual Generation 2005 - 2050 Energy GWh / year This scenario assumes hydropower development continues as planned by the Government of Mozambique according to the Energy Master Plan. Boroma 5:8+9 Lupata Mugeba Alto Malema Lurio 2 Cahora Bassa Chicamba Corumana Mavuzi Massingir Muenezi Tsate Pavua Cahora Bassa N. 7:11 7:6 Nphanda Nkuwa Investment Cost: $5.412 Billion US (between 2010 and 2040 according to Energy Master Plan) -109716 GWh Potential energy deficit due to climate change relative to BASE generation potential (2005 – 2050):
Impact on Coastal Zones, 2010 – 2050Extracted from Global Study Specific to Mozambique Cost to Protect All Vulnerable Coastal and Floodplain Areas Global study considered all land that would be affected by the 2100 highest potential sea level of ~1m and all flood-prone areas Adaptation Options Sea and River Dikes Only constructed where population density is >1person/km2 Port Upgrade Beach Nourishment Where tourist revenue is high NOTE: Adaptation costs include construction and maintenance • Further studies on specific areas (i.e. Beira and Maputo) are needed for a more relevant cost estimates • Initial study does, however, highlight the potentially huge cost of “hard” adaptation at a large scale thus further emphasizing that large scale, hard costal adaptations are unrealistic
Summary of CGE Modeling Results • Without public policy changes, the worst scenario results in a net present value of damages of nearly US$7 billion. • equivalent to an annual payment of US$390 million (5% discount rate). • Hardening rural roads reduces worst case impacts substantially, restoring approximately 1/3 of lost absorption. • Remaining welfare losses could be regained with improved agricultural productivity or human capital accumulation. • Investments costs required to restore welfare losses are subject to debate, but are reasonably less than US$390 million per year over 40 years.
Conclusion • It is our hope that we will be able to produce similar results for Vietnam as has been done for Mozambique • The ultimate goal is to find adaptation options that are of “no regret”, or infrastructure and investment that would benefit the people and economy regardless of potential climate changes • It is our thought that developing whilst adapting to climate change is essential to insuring continued economic growth