Download
1 / 9
90 likes | 116 Views
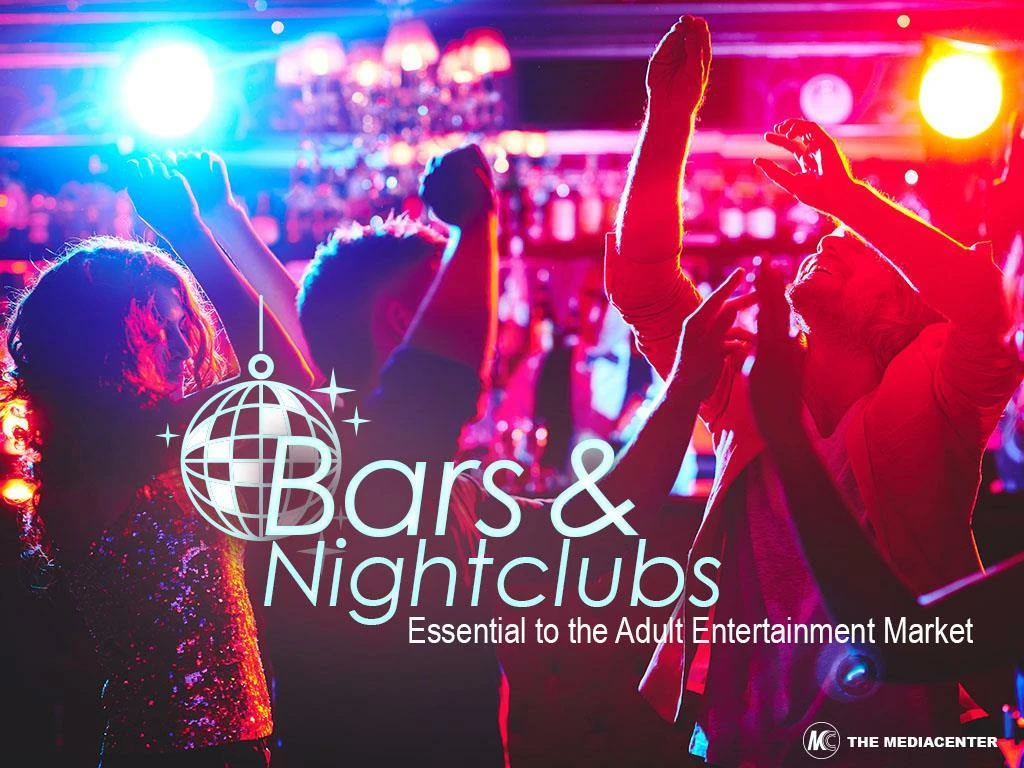
Discover latest trends, revenue sources, drink preferences, and consumer insights in the dynamic bars and nightclubs industry. Get tips on advertising and social media strategies for successful promotion.

E N D
Where A Good Time Is Had by All • As of January 2015, the US bars & nightclubs industry included approximately 70,000 businesses generating approximately $24 billion in annual revenues, which have been increasing since the low point of $21.06 billion during 2009. • Bars & nightclubs obtain their revenues from four primary sources: beer, 35%; distilled spirits/hard liquor, 35%; food and non-alcoholic beverages, 15%; and wine, 10%. • While bars are typically able to attract and maintain a loyal clientele, nightclubs, with entertainment as their primary attraction, can be a more difficult business since music and entertainment trends change quickly.
Night Out Niceties • According to 2014 research from Eventbrite, the average person spent $81 for evening activities and enjoyed a night out twice a week. On average, he or she spent $34 for a ticket to an event, $26 on drinks, $11 on transportation and $10 for late-night snacks. • Of all survey participants, 64% bought nightlife tickets for music events; followed by holiday/seasonal, 10%; food & drink, 8%; entertainment, 7%; and performing and visual arts and charity & causes, 3% each. • Eventbrite found that people who were nightlife enthusiasts in six US cities (New York, Atlanta, San Francisco, Los Angeles, Chicago and Austin) spent the most on tickets for electronic dance music (EDM), 40%, and Hip Hop/Rap shows, 31%.
Libation Selection • According to July 2014 Gallup data, beer continued to be the #1 alcoholic beer among Americans, at 41%, followed by wine, 31%, and liquor, 23%. Beer was #1 with men, at 57%; adults, 18–34, 48%; and 35–54, 43%. • According to The Brewers Association, more drinking establishments are catering to consumers’ interest in craft beers, which has prompted the association to set a goal of a 20% market share in craft beers by 2020. • Technomic’s 2015 SpiritTAB Report revealed that although vodka remained the #1 spirit, whiskey’s strong growth resulted in 40% of adults ordering American whiskey in restaurants and bars at least once a month, and was #1 for shots and sipping at bars.
Drinkers’ Data • According to Next Level Marketing’s 2014 study of on-premise national chain beverage alcohol consumers, 70% of survey participants said they visited the same types of restaurants and bars and Millennials, in particular, were patrons of more expensive bars. • The average adult ordered 2.3 drinks per visit. Men ordered more drinks than women, and Millennials ordered more drinks than older adults. Millennials were also the largest group of the 79% of all adults who tried a new drink every 90 days. • Of all survey participants, 73% had ordered a beer at a restaurant or bar during the past 30 days, 65% wine and 59% a spirit cocktail.
Where the In-Crowd Drinks • Of the top 10 nightclubs & bars, as selected by Nightclub&Bar during February 2015, seven were located in Las Vegas, as well as the top 4: XS Nightclub, Hakkasan, Marquee Nightclub and TAO Las Vegas. • In Thrillist’s Best New Bars in America 2015, five were in smaller markets: BTU Brassierie, Portland, OR; Coup d’état, Minneapolis, MN; Edmund’s Oast, Charleston, SC; Half Step, Austin, TX; and Meta, Louisville, KY. • Many of Thrillist’s Best Beer Bars in America 2015 were also in small markets: 7 Monks Taproom, Traverse City, MI; Ashley’s, Ann Arbor, MI; Brick Store Pub, Decatur, GA; Apex and Belmont Station, Portland, OR; and Burnhearts, Milwaukee, WI.
Advertising Strategies • Recommend late-night programming during Thursday, Friday and Saturday evenings to nightclubs to reach young adults, offering either a discounted cover charge for a party of a certain size or mobile coupons for food and/or beverage specials. • Sports broadcasts are the obvious time slots for sports bars to reach their target audience, promoting food and/or beverage specials or a drawing for tickets to the game of a local or regional professional sports team. • Bars and nightclubs featured on the any of the “top hot spots” list in the Profiler should use television to announce their selection and include patron testimonials about why they find these establishments so attractive.
Social Media Strategies • With younger adults a prime audience for bars and nightclubs, these establishments must have mobile-friendly Websites, with mobile-only coupon specials and links to cab companies or Uber or similar ride-sharing services to help patrons travel home safely. • Bar owners should consider promoting a special live broadcast night via Periscope or Meerkat to share spontaneous testimonials of patrons, have a bartender show how he or she makes a cocktail unique to the establishment and to show the attractive décor. • Bars and nightclubs can significantly boost their social media interaction by inviting a few regular customers to serve as “fun ambassadors,” posting comments, photos and videos about their experiences at the establishments and future entertainment and specials.