Download
1 / 20
200 likes | 220 Views
Signal Fndamentals Analogue, Discrete and Digital Signals. An analogue signal is an electrical waveform with a continuously varying possible amplitudes of a quantity such as voltage or current. It is uniquely defined for all t.

E N D
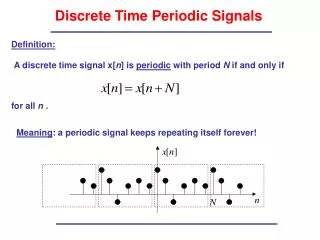
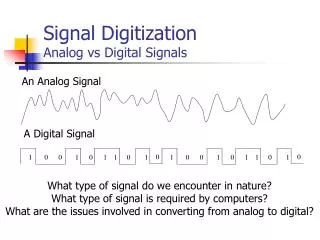
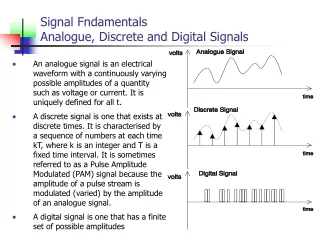
Signal FndamentalsAnalogue, Discrete and Digital Signals • An analogue signal is an electrical waveform with a continuously varying possible amplitudes of a quantity such as voltage or current. It is uniquely defined for all t. • A discrete signal is one that exists at discrete times. It is characterised by a sequence of numbers at each time kT, where k is an integer and T is a fixed time interval. It is sometimes referred to as a Pulse Amplitude Modulated (PAM) signal because the amplitude of a pulse stream is modulated (varied) by the amplitude of an analogue signal. • A digital signal is one that has a finite set of possible amplitudes
Signal FndamentalsDigital Waveforms • A digital waveform conveys digital information even though its representation is sinusoidal and consequentially has an analogue appearance. • The analogue, discrete and digital signals can be referred to as the baseband signal. 'Baseband' is used to describe the band of frequencies representing the signal of interest as delivered by the source of information.
Signal FundamentalsEven and Odd Functions • If a function v(t) = v(-t) then it is defined as an even function. An example of an even function is V = Acos wt, where w= 2pf. • If a function v(t) = -v(-t) then it is defined as an odd function. • An example of an odd function is V = Asin wt, where w= 2pf.
Signal FundamentalsSynthesis of Signals and the Frequency Domain • Any periodic signal can be synthesized by combining a series of cosine and sine signals of different harmonics. By summing different amplitudes of the 1st, 3rd, 5th, and so on harmonics of a sine signal, an odd functioned square wave can be synthesized.
Signal FundamentalsSynthesis of Signals and the Frequency Domain • The synthesized signal can be represented as a function of frequency against amplitude of a sine signal for the different harmonics. This is known as the frequency domain representation.
Signal FundamentalsSynthesis of Signals and the Frequency Domain • If the period T of the synthesized signal becomes infinitely large then the difference in frequency between the nth and the (n+1)th frequency components becomes infinitely small and a continuous frequency domain representation is obtained.
Signal FundamentalsFourier Analysis • Any periodic signal can be represented by: Where f = 1/T And w = 2pf
Signal FundamentalsFourier Analysis • The ßn terms can be found by cross correlating x(t) with sin(nwt). Cross correlation is a method of statistically comparing. • By cross correlating x(t) with cos(nwt), the an terms can be found to be • By cross correlating x(t) with 1, the A0 terms can be found to be
Signal FundamentalsFourier Analysis - example • Crosscorrelate sinwt with b1sinwt to obtain a measure of the content of sinwt within the signal b1sinwt.
Signal FundamentalsFourier Analysis - example • Crosscorrelate sin2wt with b1sinwt to obtain a measure of the content of sin2wt within the signal b1sinwt.
Signal FundamentalsFourier Analysis - example • Cross correlate coswt with b1sinwt to obtain a measure of the content of coswt within the signal b1sinwt.
Signal FundamentalsExponential Fourier Series • The exponential form of the Fourier series which is useful in signal analysis can be obtained from the trigonometric form: • By using the following relationships where and
Signal FundamentalsInverse Exponential Fourier Series • By cross correlating x(t) with e-jnwt, the cnterms can be found to be:
Signal FundamentalsExponential Fourier Series - example • Determine the exponential series of cos(wt).
Signal FundamentalsContinuous Exponential Fourier Transform • The Fourier series has so far been used to represent periodic signals. A similar expression for aperiodic signals can be represented in terms of an exponential function. The exponential function is obtained by taking the periodic series and considering what happens as the period tends to infinity. • define f = 1/T, fn = n/T and F(fn) = cnT and consider what happens to each of the equations as T tends to infinity, f tends to zero, fn approaches a continuous frequency variable f, a discrete sum becomes an integral defining the area under a continuous function F(f) and x(t) approaches an aperiodic function f(t).
Signal FundamentalsSampling Theory • Consider a message signal m(t), amplitude modulating a continuous pulse waveform xp(t) to generate a Pulse Amplitude Modulated (PAM) signal x(t). • This is a multiplication process which can be described mathematically as
Signal FundamentalsSampling Theory • xp(t) can be described as an exponential fourier series • Since xp(t) is an even function it can be expressed as a Fourier cosine series • To make things simple let m(t) = cos(wat)
Signal FundamentalsSampling Theory • When sampling an analogue signal m(t) , the pulse train sampling signal has a pulse width that tends to zero seconds therefore c0 = c1 = ... = cn = /T. • The analogue signal which is shown now consists of a range of frequency components and is designated in the frequency domain by an idealised spectrum.