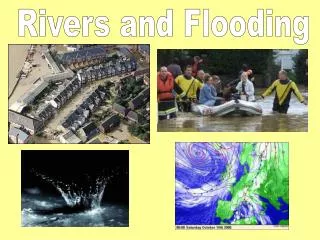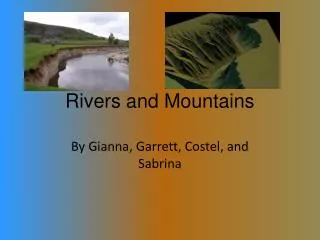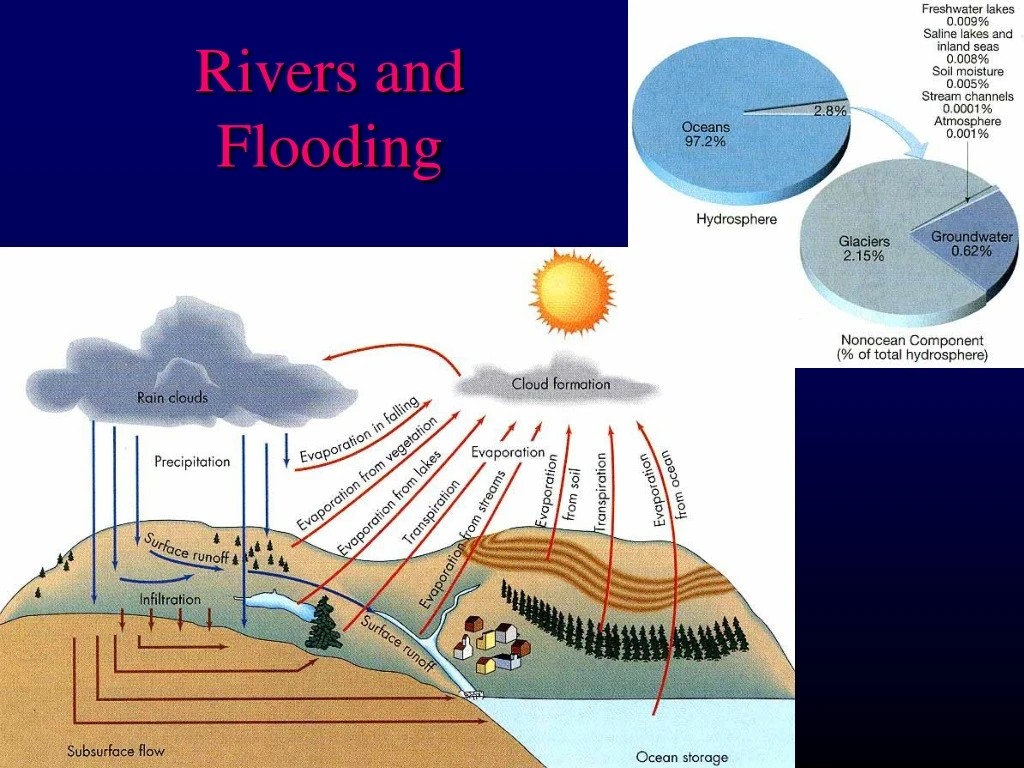
Rivers and Flooding
390 likes | 434 Views
Explore the dynamics of rivers, flooding, and drainage basins. Learn about discharge, velocity, and flood stages. Discover how factors like urbanization impact flooding and the importance of flood hazard mapping.

Rivers and Flooding
E N D
Presentation Transcript
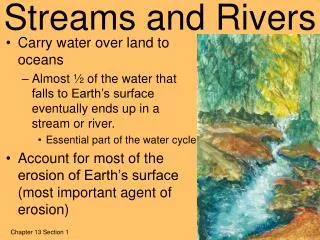
Rivers and Flooding Drainage basinorwatershed
A River Drainage Basin Mill Creek Drainage Basin
Walla Walla River Drainage Basin Mill Creek Drainage Basin
Rivers and Flooding Gradient Velocity Discharge Q = V x A ft3/sec (cfs) or m3/sec (cms) V = velocity A = Cross-sectional area = Width x mean depth Base level (ultimate and local)
2000 Hydrograph for Mill Creek at Walla Walla 1800 Averages for 1942-1990 1600 1400 1200 1000 800 600 400 Maximum 200 Mean Oct Nov Dec Jan Feb Mar Apr May Jun Jul Aug Sep Discharge (cfs)
Mill Creek Flows 3500 3000 2500 2000 Discharge (cfs) 1500 1000 500 0 0 5 10 15 Day in Feb, 1996 Hydrograph for Mill Creek flood, Feb, 1996 Measured at Kooskooskie (max. was 6000 cfs at Walla Walla)
Load: • Bed load (rolling, saltation) • Suspended load: silt and clay carried in suspension • Dissolved load: ions in solution HCO3- SO42- Ca2+ Na+ Mg2+ typically 90% of dissolved Competence: the amount of load that a particular stream can carry
Equilibrium and the longitudinal profile • Gradient • Velocity • Discharge • Load • Base level
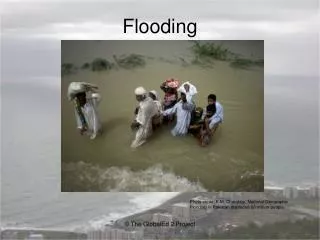
Flooding is dependent upon • precipitation in drainage basin • precipitation rate/infiltration rate • topography Flood Discharge = channel discharge when a river overflows its banks Flood Magnitude = discharge above flood discharge Flood Stage = elevation of water surface for a high-water condition likely to damage Thus depends on use of floodplain
Recurrence Interval as flood indicator Rec. Int. = (Y-1)/R Y = # of years for data R = rank of flood
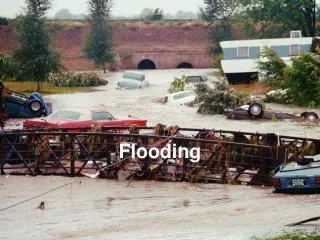
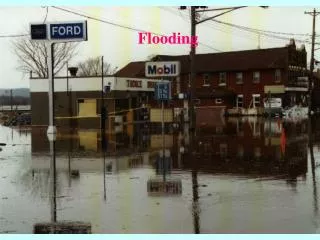
Upstream floods • In upper parts of drainage basins • Usually due to downpour in small area • Flash floods that may not flooding in larger rivers downstream • Can still be huge events locally (> 100-yr flood) Downstream floods • Produced by storms of long duration • Saturate soil and cover large area • Flooding on small tributaries may be limited, but cumulative effect is huge
Chattooga = upstream flood Savannah at Clayton = downstream flood
Development and flooding The effect of urbanization: • More rapid runoff • More frequent • Shorter lag-time • Higher peak discharge • Shorter duration
Factors in damage: • Land use on floodplain • Magnitude (depth and velocity) • Rate of rise • Effectiveness of warning systems • Season (crops lost) • Sediment load deposited
Response to Flood Hazards • Physical barriers • Levees • Flood walls with huge steel gates around towns • Retention reservoirs • Channelization to handle increase discharge • Diversion channel system (LA)
Levees protect area behind until flood becomes too great working levee failed levee levee damming water behind it
US Army Corps of Engineers attempts to control the Mississippi - Atchafalaya River
Floodplain Regulation • Combine restrictions on use and physical barriers • Goal: obtain most beneficial use of the floodplain and minimize flood damage with an overall management plan
Flood Hazard Mapping Delineate risk areas and past floods
Flood Hazard Mapping Satellite images Upper = normal flow 1988 Lower = 1993 flooding
Floodplain Zoning Establish flood-prone areas • Floodway District most susceptible • Allows development that will not increase flood elevation by > 0.3 m • Farms, pasture, wildlife sancturaries, golf, parking areas, bridle trails… • Floodway Fringe Districtless so, but still within 100-yr flood area • Allows some buildings if anchored to prevent flotation
Channelization: a controversy Adverse effects: • Aesthetics and habitat • Drainage of wetlands • Cutting trees along banks • Destroys diversity of flow patterns & changes peak flows • Destroys aesthetics • In many cases may increase flooding downstream