Download
1 / 37
370 likes | 385 Views
Delve into the anthropogenic origins of climate change through key observations, emissions data, and Svante Arrhenius's groundbreaking discoveries. Explore the IPCC's reports, Watt's steam engine impact, and future projections amid uncertainties in a warming world.

E N D
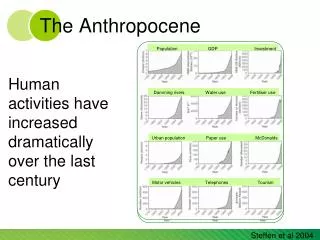
Anthropocenephysical basis of climate spring 2011 • Introduction and UNEP reports • Observations • Emissions and other natural forcings • Temperature record, SSTs • Precipitation, Sea level, ENSO, Severe storms • Attribution • Models and predictions • Uncertainties
Svante Arrhenius (1859 -1927) • Swedish • 1884 PhD dissertation electro-chemistry – did not impress advisor, 150 pages, 85 theses. • 1896 – Suggested that CO2 could warm the planet, from his work on ice ages. Emission of CO2 may prevent future ice ages. • 1903 – Nobel prize in chemistry for work in his dissertation. Most of his these would be unquestioned today
Intergovernmental panel on climate change (IPCC)Established by WMO and UNEP and confirmed by UN general assembly December 1988 Five reports issued, the latest in 2013 • 1990 human emissions are increasing atmospheric greenhouse gases, resulting increase 0.3 °C per decade 21st century. • 1995 discernible human influence on global climate • 2001 surface temperature projected to increase 1.4 - 5.8 C 1990 -2100, and sea level to rise by 0.1 - 0.9 meters • 2007 (Nobel peace prize) Climate warming unequivocal. Most increase in global temperatures since mid-20th century is (>90%) due to increase in anthropogenic greenhouse gas concentrations. • The fifth one is underway. 831 authors selected from 3000 nominations. 3-4 reviewers for each chapter.
Human activities have changed the composition of the atmosphere since the pre- industrial era Watt’s steam engine Begin industrial period
http://www.atmosphere.mpg.de/enid/20c.html Liou, 2002, pp 161 Atmospheric heating rates
Precipitation patterns have changed Annual mean precipitation change: 2071 to 2100 Relative to 1990
Climate-induced increases in sea level are caused by thermal expansion of the oceans and melting of land ice and ice sheets
El Niño years La Niña years The frequency, persistence and magnitude of El-Nino events have increased in the last 20 years The El-Nino phenomena leads to floods and droughts throughout the tropics and subtropics
Most of the observed warming in the past 50 years is attributable to human activities
Atmosphere The KP seeks to reduce total emissions by about 0.2 Humans are perturbing the carbon cycle This is the “greenhouse” problem 3.3 750 62.3 Estimated Fossil Deposits 6.3 About 16,000 60 1.6 Plants Driven by fossil fuel emissions 500 Soil 90 92.3 2000 …and land clearing Oceans 39,000 UnitsGt C for stores & Gt C y-1 for fluxes The oceans and land vegetation are currently taking up 4.6 Gt C per year
More adverse than beneficial impacts on biological and socioeconomic systems are projected
Land areas are projected to warm more than the oceans with the greatest warming at high latitudes Annual mean temperature change, 2071 to 2100 relative to 1990: Global Average in 2085 = 3.1oC
Some areas are projected to become wetter, others drier with an overall increase projected Annual mean precipitation change: 2071 to 2100 Relative to 1990
Initially increased agricultural productivity in some mid-latitude regions & reduction in the tropics and sub-tropics even with warming of a few degrees 2020s 2050s 2080s
Uncertainties • Changes in atmospheric water vapor • Changes in cloudiness • Changes in albedo • Aerosol particles • Direct effects • Impact on clouds • Black carbon