Download
1 / 31
310 likes | 392 Views
Explore pH calculations of strong monoprotic acids, polyprotic acids, and speciation diagrams using equilibrium constants. Understand the concentrations of different species in acid solutions.

E N D
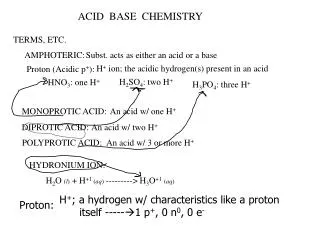
CALULATE THE pH OF A STRONG ACID Compute the pH and equilibrium concentrations of all species in a 2 x 10⁻⁴ M solution of HCl. 1) Species: H+, Cl-, HCl0, OH- 2) Mass action laws: 3) Mass balance: [HCl0] + [Cl-] = 2 x 10⁻⁴ M 4) Charge balance: [H+] = [Cl-] + [OH-]
Assumptions: HCl is a very strong acid so [H+] >> [OH-] and [Cl-] >> [HCl0] Now the only source of H+ and Cl- are the dissociation of HCl, so [H+] = [Cl-] (this is also apparent from the charge balance) Thus, pH = - log (2 x 10⁻⁴) = 3.70, and [Cl-] = 2 x 10⁻⁴ M. [OH-] = Kw/[H+] = 10-14/2 x 10-4 = 5 x 10-11 M
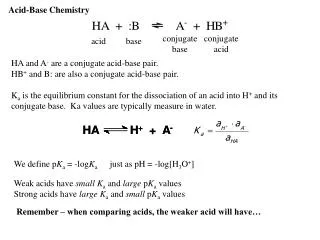
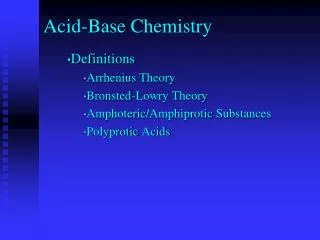
MONOPROTIC ACIDS What are the pH and concentrations of all species in a 0.1 mol L-1 HF solution? • Write out important species: 2) Write out all independent reactions and their equilibrium constants 3) Write out mass-balance expressions. 4) Write out the charge-balance expression. 5) Make reasonable assumptions.
MONOPROTIC ACIDS What are the pH and concentrations of all species in a 0.1 mol L-1 HF solution? 1) Write out important species: H+, OH-, HF0, F-. 2) Write out all independent reactions and their equilibrium constants: HF0 H+ + F- H2O(l) H+ + OH-
3) Write out mass-balance expressions: 0.1 mol L-1 = F = [F-] + [HF0] 4) Write out the charge-balance expression: [H+] = [F-] + [OH-] 5) Make reasonable assumptions: HF is an acid, so [H+] >> [OH-] the charge-balance becomes [H+] [F-] = X and the mass-balance becomes: [HF0] = 0.1 - X
6) Solve quadratic equation: a = -1; b = -10-3.2 = -6.31x10⁻⁴; c = 10-4.2 = 6.31x10-5 X1 = -0.00825; X2 = 0.00765 [H+] = [F-] = 7.65x10⁻³ mol L-1; pH = -log [H+] = 2.12 [HF0] = 0.1 - 0.00765 = 0.0924 mol L-1
7) Check assumption: 1.318x10⁻¹² << 7.65x10⁻³, so [OH-] << [H+]. What if we assumed [HF0] >> [F-], i.e., [HF0] 0.1? This might be valid because HF is a weak acid. 10-3.2 = X2/0.1 X2 = 10-4.2 X = 10-2.1 = 0.00794 [H+] = [F-] = 7.94x10⁻³ mol L-1; pH = 2.10 [HF0] = 0.1 - 0.00794 = 0.092 mol L-1 The above answer is only 8% different from 0.1. It seems in any case where KA < 10-3.2, the above assumption should be good!
POLYPROTIC ACID What is the pH and concentration of all species in a 0.1 mol L-1 solution of H3PO4? 1) Species: H+, OH-, H3PO40, H2PO4-, HPO42-, PO43- 2) Mass action expressions: H3PO40 H2PO4- + H+ H2PO4- HPO42- + H+ HPO42- PO43- + H+
H2O(l) H+ + OH- 3)Mass-balance 0.1 mol L-1 = [H3PO40] + [H2PO4-] + [HPO42-] + [PO43-] 4) Charge-balance [H+] = [H2PO4-] + 2[HPO42-] + 3[PO43-] + [OH-] 5) Assumptions a) Because H3PO40 is an acid [H+] >> [OH-] b) Because H2PO4- and HPO42- are very weak acids and H3PO40 is only moderately weak: [H3PO40] > [H2PO4-] >> [HPO42-] >> [PO43-] so, 0.1 = [H3PO40] + [H2PO4-] and [H+] = [H2PO4-] = X.
10-3.1 - 10-2.1X - X2 = 0 X1 = 0.0245; X2 = -0.0324 [H+] = [H2PO4-] = 0.0245 mol L-1; pH = 1.61 [H3PO40] = 0.1 - 0.0245 = 0.0755 mol L-1 So [HPO42-] = 10-7.0 mol L-1
[PO43-] = 10-17.79 = 1.62x10⁻¹⁸ mol L-1 [OH-] = 10-14/10-1.61 = 10-12.39 = 4.07x10⁻¹³ mol L-1
GRAPHICAL APPROACH TO EQUILIBRIUM CALCULATIONS Consider the monoprotic acid HA: CT = 10-3 = [HA0] + [A-]; so [A-] = CT - [HA0] KA[HA0] = [H+][A-] KA[HA0] = [H+](CT - [HA0]) KA[HA0] = [H+]CT - [H+][HA0] KA[HA0] + [H+][HA0] = [H+]CT
CT - [A-] = [HA] CTKA - KA[A-] = [H+][A-] CTKA = [A-]([H+] + KA) 1) At pH < pKA, [H+] >> KA so [H+] + KA [H+] [HA0] = CT([H+]/[H+]) = CT log [HA0] = log CT [A-] = CTKA/[H+] log [A-] = log CT - pKA + pH
2) pH = pKA; [H+] = KA so [H+] + KA = 2[H+] [HA0] = CT[H+]/(2[H+]) = CT/2 log [HA0] = log CT - log 2 = log CT - 0.301 [A-] = CT [H+]/(2[H+]) = CT/2 log [A-] = log CT - log 2 = log CT - 0.301 3) pH > pKA; [H+] << KA so KA+ [H+] KA [HA0] = CT[H+]/KA log [HA0] = log CT + pKA - pH [A-] = CTKA/KA = CT log [A-] = CT
SPECIATION DIAGRAM FOR A DIPROTIC SYSTEM Consider H2S with pK1 = 7.0, pK2 = 13.0 ST = 10-3 M = [H2S0] + [HS-] + [S2-]
log [H2S0] = log ST 1) pH < pK1 < pK2; [H+] > K1 > K2 log [HS-] = log (STK1) + pH log [S2-] = log (STK2K1) + 2pH
log [H2S0] = log ST - 0.301 2) pH = pK1 < pK2; [H+] = K1 > K2 log [HS-] = log ST - 0.301 log [S2-] = log (STK2/2) + pH
log [H2S0] = log (ST /K1) - pH 3) pK1 < pH < pK2; K1 > [H+] > K2 log [HS-] = log ST log [S2-] = log (STK2) + pH
log [H2S0] = log (ST/2K1) - pH 4) pK1 < pK2 = pH; K1 > [H+] = K2 log [HS-] = log ST - 0.301 log [S2-] = log ST - 0.301
log [H2S0] = log (ST /K1K2) - 2pH 5) pK1 < pK2 < pH; K1 > K2 > [H+] log [HS-] = log (ST /K2) - pH log [S2-] = log ST
Bjerrum plot showing the activities of reduced sulfur species as a function of pH for a value of total reduced sulfur of 10-3 mol L-1.
Easier approach: 10-7 = [HS-] [H+] / H2S [HS-] / [H2S] = 10-7 / [H+] The lower the pH, the higher [H+], the smaller 10-7 / [H+], the smaller [HS-] / [H2S] and the higher [H2S] 10-12.9 = [S2-] [H+] / HS- [S2-] / [HS] = 10-12.9 / [H+] The higher the pH, the lower [H+], the higher 10-12.9 / [H+], the higher [S2-] / [HS-] and the higher [S2-]
This type of diagram is called a Bjerrum diagram,after its originator. Although the previous examples were calculated in detail, it is possible to sketch the relationships based only on the Ks of the dissociation reactions. These will show the pH ranges of the dominant species; i.e. the species that is controlling the chemistry, except for a small region in the vicinity of the K value. This is illustrated in the following slide.
THE CO2-H2O SYSTEM - I Carbonic acid is a weak acid of great importance in natural waters. The first step in its formation is the dissolution of CO2(g) in water according to: CO2(g) CO2(aq) At equilibrium we have: Once in solution, CO2(aq) reacts with water to form carbonic acid: CO2(aq) + H2O(l) H2CO30
THE CO2-H2O SYSTEM - II In practice, CO2(aq) and H2CO30 are combined and this combination is denoted as H2CO3*. It’s formation is dictated by the reaction: CO2(g) + H2O(l) H2CO3* For which the equilibrium constant at 25°C is: Most of the dissolved CO2 is actually present as CO2(aq); only a small amount is actually present as true carbonic acid H2CO30.
BJERRUM PLOTS • These are used for closed systems with a specified total carbonate concentration. They plot the log of the concentrations of various species in the system as a function of pH. • The species in the CO2-H2O system: H2CO3*, HCO3-, CO32-, H+, and OH-. • At each pK value, conjugate acid-base pairs have equal concentrations. • At pH < pK1, H2CO3* is predominant, and accounts for nearly 100% of total carbonate. • At pK1 < pH < pK2, HCO3- is predominant, and accounts for nearly 100% of total carbonate. • At pH > pK2, CO32- is predominant.
Bjerrum plot showing the activities of inorganic carbon species as a function of pH for a value of total inorganic carbon of 10-3 mol L-1. In most natural waters, bicarbonate is the dominant carbonate species!
A Bjerrum plot shows the relative importance of the various species in an acid-base system under closed conditions (i.e., the total concentration of all species is constant). For example, for the CO2-H2O system, a Bjerrum plot shows the concentrations of H2CO3*, HCO3-, CO32-, H+, and OH-, under the condition that the sum of the concentrations of H2CO3*, HCO3- and CO32- is constant. The Bjerrum plot is constructed based partially on the concepts discussed in slide 6. That is: 1) At each pK value, conjugate acid-base pairs have equal concentrations; 2) At pH < pK1, H2CO3* is predominant, and accounts for nearly 100% of total carbonate; 3) At pK1 < pH < pK2, HCO3- is predominant, and accounts for nearly 100% of total carbonate; and 4) At pH > pK2, CO32- is predominant. The Bjerrum plot is also constructed assuming that activity coefficients can be neglected. When pH < pK1, and H2CO3* is predominant, the concentrations/activities of the other carbonate species can be derived by rearranging the mass-action expressions for the dissociation reactions, and the mass-balance constraint that the sum of the concentrations of H2CO3*, HCO3- and CO32- is constant. For example, rearranging the equation given in the notes to slide 6 yields: log aHCO3- = pH - pK1 + log aH2CO3* At pH < pK1, the concentration of H2CO3* is approximately equal to the total concentration of all carbonate species, and is hence, approximately constant. Thus, the equation shows that, at pH < pK1, the concentration of bicarbonate increases one log unit for each unit increase in pH. Similar equations can be derived for all the carbonate species in each of the pH ranges of the diagram. For more details, consult Faure (1998) Principles and Applications of Geochemistry, Prentice-Hall (Chapter 9, pp. 123-124).