Download

1 / 14
140 likes | 177 Views
Explore methodologies to detect tipping points with early-warning signals using various data sets, such as glaciation events and grazing models. Results show the effectiveness of AR(1)/Variance and skewness indicators. Further research is needed to improve the accuracy of predicting critical transitions.

E N D
Can we reliably provide early warnings for tipping points? Brian Huang Claudie Beaulieu
Outline • Background • Methodology/Objectives • Results • Discussion
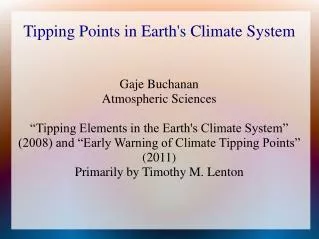
Tipping Point: A “critical threshold at which a tiny perturbation can qualitatively alter the state or development of a system” (Lenton et al., 2008) “Early-warning signals for critical transitions” (Scheffer et al., 2009)
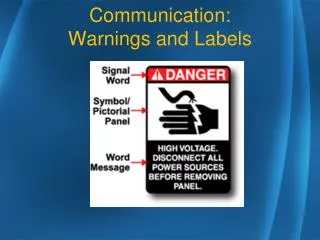
Before a Critical TransitionCritical Slowing Down (Autocorrelation/Variance)Skewness and Flickering Before Transitions Interpolated “Early-warning signals for critical transitions” (Scheffer et al., 2009)
Methodology/Objectives • Compare ways to calculate AR(1) on unevenly spaced data: • Take the mean of evenly spaced buckets of data (e.g. Lenton et al., 2011) • Linearly interpolate evenly spaced data (Dakos et al., 2008) • Fit AR(1) to raw data (unevenly spaced) (Mudelsee, 2002) • Examine all three indicators together • Couple AR(1)/Variance • Apply to data sets that haven’t been studied in the literature • Apply to vegetation-grazing model to judge risk of false alarms and power of technique
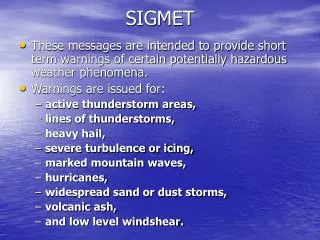
Tipping Points Analyzed • End of Glaciation Events (1 every ~100,000 yrs) • While glaciation events are gradual, end of glaciation events are abrupt • End of Younger Dryas Stadial (~11,600 yearsBP) • Post-Glacial Cooling (~8,200 yearsBP) • Very small, but well documented http://www.ncdc.noaa.gov/paleo/abrupt/images/data2-dome-fuji-lg.gif
The Three Indicators (Successful AR(1)/Variance) Vostok Ice Core Data (Glaciation 1) Petit et al. (1999) Trends significant for the 99% confidence level
The Three Indicators (Successful Skewness) Global Methane Conc. Data (Glaciation 1) Spahni et al. (2005) Trends significant at the 99% confidence level
The Three Indicators (Miss) Global Benthic O18 Data (Glaciation 1) Lisiecki and Raymo (2005) Trends significant at the 99% confidence level
Summary of Results (Paleoclimate) Note: only tipping points that are far enough apart are analyzed.
Summary of Results (Grazing Model) Rising Grazing 78.4/86.6 Rising Grazing Noise 100/99.6 Rising Veg. Noise 77.8/81.6 % Significant AR(1)/Variance % Significant Skewness Halting Grazing 95.3/88.2 Constant Grazing 20.7/86.5
Discussion/Further Progress • Different data sets lead to different conclusions about the same events. • Indicators may also be fallible to false positives • More research necessary before we can use these indicators to provide early warning signals • Needs extension to predict the timing of impending critical transitions • Automating the selection of parameters
Acknowledgements • Jorge Sarmiento • Vishwesha Guttal • PEI