Download
1 / 29
290 likes | 457 Views
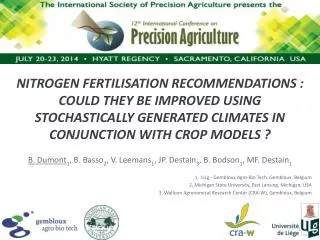
NITROGEN FERTILISATION RECOMMENDATIONS : COULD THEY BE IMPROVED USING STOCHASTICALLY GENERATED CLIMATES IN CONJUNCTION WITH CROP MODELS ?. B. Dumont 1 , B. Basso 2 , V. Leemans 1 , JP. Destain 3 , B. Bodson 1 , MF. Destain 1 1, ULg - Gembloux Agro-Bio Tech, Gembloux, Belgium

E N D
NITROGEN FERTILISATION RECOMMENDATIONS : COULD THEY BE IMPROVED USING STOCHASTICALLY GENERATED CLIMATES IN CONJUNCTION WITH CROP MODELS ? B. Dumont1, B. Basso2, V. Leemans1, JP. Destain3, B. Bodson1, MF. Destain1 1, ULg - Gembloux Agro-Bio Tech, Gembloux, Belgium 2, Michigan State University, East Lansing, Michigan, USA 3, Walloon Agronomical Research Center (CRA-W), Gembloux, Belgium
Context : History Since1950 Intensification of agricultural systems Intensification of fertilizer application 1991 European Nitrate Directive 91/6/76/EEC Maintain productivity – Decrease N environmental pressure 2002 Sustainable Nitrogen Management in Agriculture Program (PGDA) Transposition of EEC 91/6/76 : a guide of « good practices » 2009-2013 N fertilizer use would have increased by 6% in 10 / 27 EU state members Agriculture could be responsible for 50% of total N in surface water in EU 2014-??? With CC : Increasing frequencies of extreme weather events Quantifying the climatic uncertainty impacting cropping systems For the future There’s a need for Tools and Decision support systems 2
An original experiment was designed to study the winter wheat growth under different growing conditions : Soil types : sandy loam vs. classical loam Nitrogen fertilisation level : 0-120-180-240uN 7 protocols Nitrogen fertilisation rate : 2 or 3 applications Climatic variability : Since 2008 – Till 2014 Context :Case study (1/4) CRA-W 3
Crop and environmental measurements : What ? When ? # plants, after emergence # tillers, after tillering stage # grains per ear, after flowering stage LAI development, once a month Total biomass and grain yield, once every 2 weeks Final grain yield, at harvest N soil profile (by 15cm layer), once every 2 weeks N concentration in plant organs, at harvest Soil Water content, continuously (Microsensors) Context :Case study (2/4) 4
Context :Case study (3/4) • The Ernage weather database • Part of the national observation network : Royal Meteorological Institute (IRM) of Belgium • 30-years of historical records • Located 2 kilometers from the field • Available measurements : • Temperature • Vapor pressure • Solar radiation • Rainfall • Wind spedd 5
The STICS soil-crop model (Inra, France) Simulateur mulTIdisciplinaire pour Culture Standard (Multidisciplinary model for standard culture) Context :Case study (4/4) 6
The STICS soil-crop model validation A correctly calibrated crop model is a key solution !!! Plant parameters were optimised, BUT soil was parameterised !!! Context :Case study (4/4) RMSE = 1.91 ton ha-1 EF = 0.87 ND = 0.1 Simulated biomass [ton ha-1] 7 Observed biomass [ton ha-1]
Objectives FROM TOOLS • Crop models are effective to assess different cropping systems inputs • Agro-environmental conditions • Management practices • Climatic conditions • Weather generators can be used to evaluate the climatic uncertainties • Based on historical records • Stochastically derived weather time series • Probability risk assessment TOWARDS DSS • Developping a promising methodology • based on the concomitant use of crop models and weather generators • allowing to study the effect of different N fertilisation practices • Design an OPTIMAL strategic approach • Optimisation of theeconomic and environmental N-Use efficiencies 8
Material and Method (1/4) Defining Nitrogen management strategies • Historical Belgian farmer current N practice : 60-60-60 kgN ha-1 9
Material and Method (1/4) Defining Nitrogen management strategies • Historical Belgian farmer current N practice : 60-60-60 kgN ha-1 • The timing of application was maintained • The two first N doses are kept at 60 kgN ha-1 • Only the Flag-Leaf application will be modified Wheat is able to compensate early climatic stresses (tiller, #grains, …) Need to avoid early N stress 10
Material and Method (1/4) Defining Nitrogen management strategies • Historical Belgian farmer current N practice : 60-60-60 kgN ha-1 • The timing of application was maintained • The two first N doses are kept at 60 kgN ha-1MODULO-60 Strategies • Only the Flag-Leaf application will be modified 11
Material and Method (2/4) Synthetic weather time series : The LARS-WG (Semenov and Barrow, 2002) • Deconstructing the Ernage WDB • Analysis of the daily mean, std, maxima/minima • Decomposition in wet and dry series • Return time of rainy events Stochastically derived Climatic conditions # 300 time series Ernage WDB # 30 years 12 12 Semenov, M.A., Barrow, E.M., 2002. LARS-WG - A stochastic weather generator for use in climate impact studies. User manual, version 3.0, August 2002. Tech. rep., Rothamsted Research, Harpenden, Hertfordshire, AL5 2JQ, UK.
Material and Method (3/4) • Defining decision criteria • Agronomical criterion • Maximal Yield Agro-Economic criterion • Marginal Net Revenue (MNR) • YN = Yield obtained under given N level • GP = Grain selling price ~ 200 eur ha-1 • N = Amount of N fertilised • NP = Cost of N ~ 300 eur ha-1 @ 27%N 13
Material and Method (3/4) • Defining decision criteria • Agronomical criterion • Maximal Yield Agro-Economic criterion • Marginal Net Revenue (MNR) • Agro-Economico-Environmental criterion • Environmental-Friendly Net Revenue (ENR) – designed according to PGDA • SNC = Soil N content in the 0-90 cm profile after harvest 14
Material and Method (4/4) • Designing a Strategic approach • A Strategic management aims to achieve a global and long-termobjective • Only the climatic hazards will be of interest • Weather generators will be used to derive synthetic time series • The impact of two fixed and one variable N practice will be evaluated Climatic dataset necessary to simulate a complete crop season Synthetic weather … ! Action ! ? Action ? 15
Simulating the Modulo-60 strategies Example with the Belgian farmers’ current N practice : 60-60-60 kgN ha-1 Results (1/8) 16
Simulating the Modulo-60 strategies Example with the Belgian farmers’ current N practice : 60-60-60 kgN ha-1 In terms of risk for the farmers The worst climate is the more likely to happen Climate ‘+’ = Probability of 0 Climate ‘-’ = Probability of 1 Results (2/8) Climat “+” Climat “-” 17
Results (3/8) Constructing the 3D-response surface Wheat culture Given agro-pédological conditions Under local climate conditions Under different N treatment Climate ‘+’ N + N - 18 Climate ‘-’
Results (4/8) Optimising N management It is impossible to determine the climatic conditions that will occur till harvest ! It is impossible to determine the best N practice for that given year ! Climate ‘+’ N + N - 19 Climate ‘-’
Results (5/8) Optimising N management Linear relationship between the optimal N (•) and the corresponding climatic probability Climate ‘+’ N + N - 20 Climate ‘-’
Results (6/8) Optimising N management According to Basso et al. (2012), one has to determine the optimal N practice has the one that outperforms the others 75% of the time (3years out of 4) 60-60-50 kgN ha-1 60-60-40 kgN ha-1 Climate ‘+’ N + N - 21 Climate ‘-’
Results (7/8) According to the graphical analysis one could decrease the flag-leaf application up to 60-60-40 kgN ha-1 Obviously fonction of genotype and soil properties Mainly linked to N costs and grain selling prices 22
Results (8/8) A Wilcoxon test to compare statistically equivalent distributions According to the graphical analysis one could decrease the flag-leaf application up to 60-60-40 kgN ha-1 According to the statistical analysis one could decrease the flag-leaf application up to 60-60-20 kgN ha-1 23
An optimal strategic N management DSS was developed, allowing To quantify the risk for farmers To maximize farmers revenues To reduce the environmental pressure To optimize N practice Conclusions 24
An optimal strategic N management DSS was developed, allowing To quantify the risk for farmers To maximize farmers revenues To reduce the environmental pressure To optimize N practice Easy coupling with SPATIAL soil maps Conclusions 25
An optimal strategic N management DSS was developed, allowing To quantify the risk for farmers To maximize farmers revenues To reduce the environmental pressure To optimize N practice Easy coupling with SPATIAL soil maps Easy coupling with REAL-TIME data acquisition (either in-season sensors measurements or climatic records) Conclusions 26
Defining the climatePositioning the yield Conclusions 27 27
An optimal strategic N management DSS was developed, allowing To quantify the risk for farmers To maximize farmers revenues To reduce the environmental pressure To optimize N practice Easy coupling with SPATIAL soil maps Easy coupling with REAL-TIME data acquisition (either in-season sensors measurements or climatic records) And then, this is even more PA !! Conclusions 28
NITROGEN FERTILISATION RECOMMENDATIONS : COULD THEY BE IMPROVED USING STOCHASTICALLY GENERATED CLIMATES IN CONJUNCTION WITH CROP MODELS ? -Thank you for your attention Benjamin Dumont Benjamin.dumont@ulg.ac.be 29