Measurement of Nitrous Oxide Fluxes in Edinburgh: Insights from Urban Emission Studies
This study presents direct measurements of nitrous oxide (N2O) emissions in Edinburgh, Scotland, using an ultrasonic anemometer mounted on the Nelson Monument. Conducted in November 2005, the research reveals a significant urban contribution to N2O emissions, particularly following a daily cycle influenced by local combustion activities. The findings indicate that urban N2O fluxes are comparable to emissions from agricultural fertilizer application. These measurements provide essential data for refining N2O emission factors in urban settings, which is critical for improving greenhouse gas inventories.

Measurement of Nitrous Oxide Fluxes in Edinburgh: Insights from Urban Emission Studies
E N D
Presentation Transcript
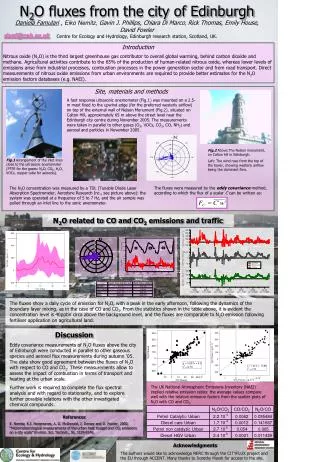
N2O fluxes from the city of Edinburgh Daniela Famulari , Eiko Nemitz, Gavin J. Phillips, Chiara Di Marco, Rick Thomas, Emily House, David Fowler Centre for Ecology and Hydrology, Edinburgh research station, Scotland, UK. danf@ceh.ac.uk Introduction Nitrous oxide (N2O) is the third largest greenhouse gas contributor to overall global warming, behind carbon dioxide and methane. Agricultural activities contribute to the 65% of the production of human-related nitrous oxide, whereas lower levels of emissions arise from industrial processes, combustion processes in the power generation sector and from road transport. Direct measurements of nitrous oxide emissions from urban environments are required to provide better estimates for the N2O emission factors databases (e.g. NAEI). Site, materials and methods A fast response ultrasonic anemometer (Fig.1) was mounted on a 2.5-m mast fixed to the upwind edge (for the preferred westerly airflow) on top of the external wall of Nelson Monument (Fig.2), situated on Calton Hill, approximately 65 m above the street level near the Edinburgh city centre during November 2005. The measurements were taken in parallel to other gases (O3, VOCs, CO2, CO, NH3) and aerosol and particles in November 2005. Fig.2Above:The Nelson monument, on Calton hill in Edinburgh. Left: The wind rose from the top of the tower, showing westerly airflow being the dominant flow. Fig.1Arrangement of the inlet lines close to the ultrasonic anemometer (PTFE for the gases: N2O, CO2, H2O, VOCs, copper tube for aerosols). The fluxes were measured by the eddy covariance method, according to which the flux of a scalar C can be written as: The N2O concentration was measured by a TDL (Tunable Diode Laser Absorption Spectrometer, Aerodyne Research Inc., see picture above): the system was operated at a frequency of 5 to 7 Hz, and the air sample was pulled through an inlet line to the sonic anemometer. N2O related to CO and CO2 emissions and traffic The fluxes show a daily cycle of emission for N2O, with a peak in the early afternoon, following the dynamics of the boundary layer mixing, as in the case of CO and CO2. From the statistics shown in the table above, it is evident the concentration level is 40ppbV circa above the background level, and the fluxes are comparable to N2O emission following fertiliser application on agricultural land. Discussion Eddy covariance measurements of N2O fluxes above the city of Edinburgh were conducted in parallel to other gaseous species and aerosol flux measurements during autumn ‘05. The data show good agreement between the fluxes of N2O with respect to CO and CO2. These measurements allow to assess the impact of combustion in terms of transport and heating at the urban scale. Further work is required to complete the flux spectral analysis and with regard to stationarity, and to explore further possible relations with the other investigated chemical compounds. The UK National Atmospheric Emissions Inventory (NAEI) implied relative emission ratios: the average values compare well with the relative emission factors from the scatter plots of N2O with CO and CO2. References E. Nemitz, K.J. Hargreaves, A. G. McDonald, J. Dorsey and D. Fowler, 2002, “Micrometeorological measurements of the urban heat budget and CO2 emissions on a city scale” Environ. Sci. Technol., 36, 3139-3146. Acknowledgments The authors would like to acknowledge NERC through the CITYFLUX project and the EU through ACCENT. Many thanks to Dorothy Marsh for access to the site.