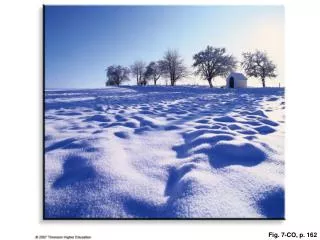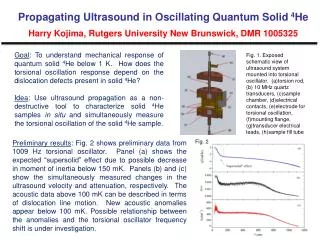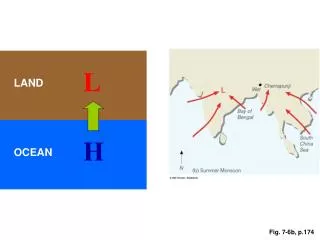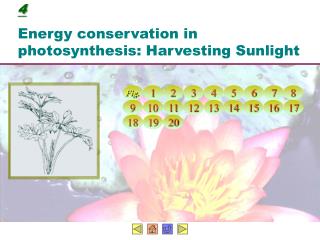
Fig. 7-0c
Light energy. 6. + 6. H 2 O. CO 2. C 6 H 12 O 6. O 2. + 6. Oxygen gas. Carbon dioxide. Water. Glucose. Photosynthesis. Fig. 7-0c. Figure 7.2_1. Leaf Cross Section. Leaf. Mesophyll. Vein. Mesophyll Cell. CO 2. O 2. Chloroplast. Stoma. Figure 7.2_2. Chloroplast.
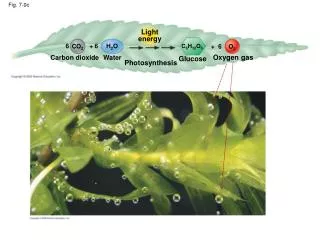

Fig. 7-0c
E N D
Presentation Transcript
Light energy 6 + 6 H2O CO2 C6H12O6 O2 + 6 Oxygen gas Carbon dioxide Water Glucose Photosynthesis Fig. 7-0c
Figure 7.2_1 Leaf CrossSection Leaf Mesophyll Vein Mesophyll Cell CO2 O2 Chloroplast Stoma
Figure 7.2_2 Chloroplast Inner and outermembranes Granum Thylakoid Thylakoid space Stroma
Figure 7.5_s1 H2O Light NADP+ ADP P LightReactions (in thylakoids) Chloroplast
Figure 7.5_s2 H2O Light NADP+ ADP P LightReactions (in thylakoids) ATP NADPH Chloroplast O2
Figure 7.5_s3 H2O CO2 Light NADP+ ADP P CalvinCycle LightReactions (in stroma) (in thylakoids) ATP NADPH Chloroplast Sugar O2
Figure 7.6B Light Reflectedlight Chloroplast Absorbedlight Thylakoid Transmittedlight
Figure 7.6A Increasing energy 103 nm 103 nm 106 nm 103 m 1 m 105 nm 1 nm Gammarays Radiowaves Micro-waves UV Infrared X-rays Visible light 400 380 750 500 600 700 Wavelength (nm) 650nm
Figure 7.7B Photosystem Light Light-harvestingcomplexes Reaction-centercomplex Primary electronacceptor Thylakoid membrane Pigmentmolecules Pair ofchlorophyll a molecules Transferof energy
Figure 7.7A Excited state Photonof light Heat Photon(fluorescence) Ground state Chlorophyllmolecule
Figure 7.9 1 2 Chloroplast To CalvinCycle H+ ATP ADP P Light Light Stroma(low H+concentration) NADPH H+ H+ NADP+ H+ H+ Thylakoidmembrane H+ H+ H+ H+ H2O H+ H+ O2 + 2 H+ H+ H+ Thylakoid space(high H+concentration) H+ H+ H+ H+ Electrontransport chain H+ Photosystem II Photosystem I ATP synthase
Figure 7.UN03 Mitochondrion Chloroplast Intermembranespace H c. Membrane Matrix d. a. e. b.