Chapter 7 Random Variables a variable whose value is a numerical outcome of a random phenomenon.
130 likes | 504 Views
Chapter 7 Random Variables a variable whose value is a numerical outcome of a random phenomenon. 7.1 Discrete and Continuous Random Variables 7.2 Means and Variances of Random Variables. Turn in AP Registration. 7.1 Discrete and Continuous Random Variables. Discrete Random Variable

Chapter 7 Random Variables a variable whose value is a numerical outcome of a random phenomenon.
E N D
Presentation Transcript
Chapter 7Random Variablesa variable whose value is a numerical outcome of a random phenomenon. 7.1 Discrete and Continuous Random Variables 7.2 Means and Variances of Random Variables Turn in AP Registration
7.1 Discrete and Continuous Random Variables Discrete Random Variable • a random variable with a countable number of outcomes • the probability distribution lists the values and their probabilities. Example: Mrs. Pfeiffer’s Grade Distribution X = 15% A’s, 30% B’s, 30% C’s, 15% D’s, and 10% F’s x = Grade 0 1 2 3 4 Probability .1 .15 .30 .30 .15 Find the probability that a randomly selected student receives a B or better. P(x 3) =
7.1 Discrete and Continuous Random Variables Continuous Random Variable • a random variable that takes all values in an interval of numbers • the probability distribution is described by a density curve • the probability of an event is the area under the density curve Example: Let S = {all numbers such that } The result of many trials are represented by the density curve of a uniform distribution. 0 1 a. b. c.
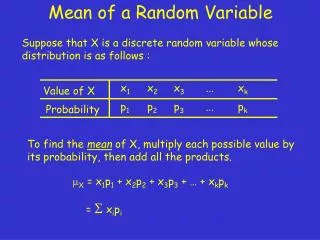
Means of Discrete Random Variables Mean of a Discrete Random Variable (aka Expected Value or Weighted Average) Mean = E(X) = µx = Example – Suppose you are playing the Missouri Pick 3 Lotto. If you match the 3 numbers exactly, you win $500. How much can you expect to win? On Pink Sheet
Expected Value Explanation We predict that in the LONG RUN, the average Lottery ticket buyer wins an average of $0.50 each time. Look at it from the state’s standpoint: Lotto tickets cost $1, so in the LONG RUN, the state keeps half of the money everyone wages. Expected Value can be misleading – we don’t expect to win $0.50 on one lottery ticket.
Variances of Discrete Random Variables On Pink Sheet Variance of a Discrete Random Variable Variance = Var(X) = σx = Standard Deviation = σx= sq. root of variance Example – Suppose you are playing the Missouri Pick 3 Lotto. If you match the 3 numbers exactly, you win $500. What is the variation of the payout? 2
Example – Mean and Variance of a Discrete Random Variable Toss 4 coins and record the number of heads. Create a probability distribution table and find the mean and standard deviation of X. X =
Example – Mean of a Continuous Random Variable Find the value of X for which the area under the curve is ½ on each side. density curve normal distribution
Law of Large Numbers Law of Large Numbers says that for ALL POPULATIONS (not just normal distributions) that as the number of observations drawn increases, the mean of the observed values (the sample mean = ) eventually approaches the mean of the population (). This is why casinos stay in business!!!
WARM UP The distribution of weights of 9 ounce bags of a particular brand of potato chips is approximately Normal with mean μ = 9.12 ounces and standard deviation σ = 0.15 ounce. • Draw an accurate sketch of the distribution of potato chip bag weights. (Be sure to label 1, 2, and 3, standard deviations from the mean.) • A bag that weighs 8.87 ounces is at what percentile in this distribution? • What percent of bags weigh between 8.25 ounces and 9.25 ounces? • The top 10% of all bags weigh at least what?