Download
1 / 45
450 likes | 549 Views
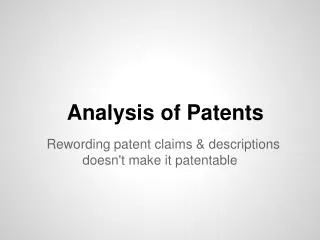
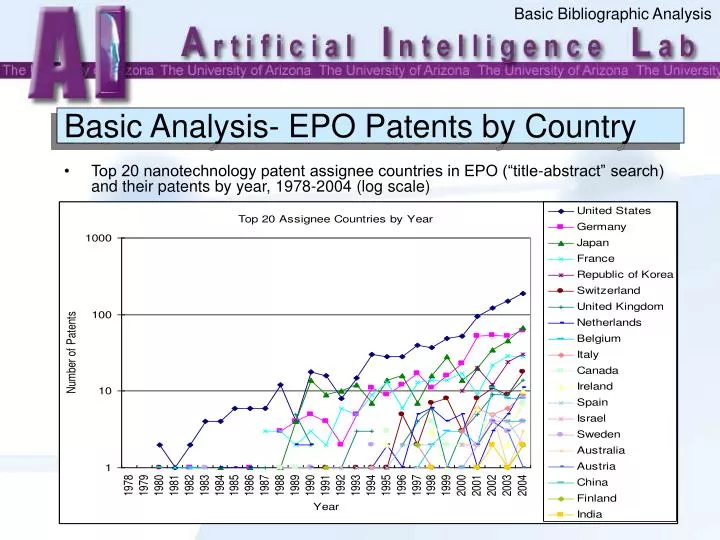
Basic Bibliographic Analysis. Basic Analysis- EPO Patents by Country. Top 20 nanotechnology patent assignee countries in EPO (“title-abstract” search) and their patents by year, 1978-2004 (log scale). Basic Bibliographic Analysis. Basic Analysis- USPTO Patents by C ountry Group .

E N D
Basic Bibliographic Analysis Basic Analysis- EPO Patents by Country • Top 20 nanotechnology patent assignee countries in EPO (“title-abstract” search) and their patents by year, 1978-2004 (log scale)
Basic Bibliographic Analysis Basic Analysis- USPTO Patents by Country Group • Assignee country group analysis by year, 1976-2004 (“title-abstract” search) (log scale)
Basic Bibliographic Analysis Basic Analysis- EPO Patents by Country Group • Assignee country group analysis by year, 1978-2004 (“title-abstract” search) (log scale)
Content Map Analysis Content Map Analysis (USPTO) • USPTO Content Map (1976-1989) (“title-abstract” search)
Content Map Analysis Content Map Analysis (USPTO) 4.18 5.39 6.036.51 6.93 7.33 7.75 8.23 8.869.3210.07 NEW REGION -0.800.41 1.051.53 1.95 2.35 2.77 3.25 3.88 4.34 5.09 NEW REGION • USPTO Content Map (1990-1999) (“title-abstract” search) • USPTO Content Map (2000-2004) (“title-abstract” search)
Content Map Analysis Findings –Content Map (USPTO) • From 1976 to 1989, the major research topics of USPTO nanotechnology patents included: “carbon atoms,” “optical fibers,” and “thin films.” • From 1990 to 1999, several new research topics appeared from 1990 to 1999, including: “aqueous solutions,” “composite materials,” “laser beams,” “nucleic acids,” “optical waveguide,” “organic colvents,” “reverse osmosis,” “self-assembled monolayer,” “semiconductor substrate,” “silicon carbide,” and “substrate surfaces.” • From 2000 to 2004, the numbers of patents related to several topics had increased significantly, such as “aqueous solutions,” “composite materials,” “carbon nanotubes,” “nucleic acids,” “self-assembled monolayer,” and “thin films.” Some new topics also became major research topics in this time period, such as “atomic force microscope,” “clay materials,” “dielectric layers,” “nanocomposite materials,” “naphtha stream,” “polymeric materials,” and “semiconductor devices.”
Citation Network Analysis Citation Network Analysis- USPTO Countries
Citation Network Analysis Citation Network Analysis- EPO Countries
Citation Network Analysis Findings – Country Citation Network • In the USPTO dataset, the United States is the most significant citation center on the network. Japan, Republic of Korea, the United Kingdom, China (Taiwan) and Germany are the secondary citation centers and constructed a cluster with close citations. • In the EPO dataset, the United States, France, Japan, Germany, and the United Kingdom are large citation centers and construct a citation cluster on the network. • In both repositories, the countries have close citation relationships. In EPO most assignee countries have more than one citing/cited country. In USPTO several countries only have citation relationship with the United States. Many of the countries that only had citations with the United States were relatively new in the nanotechnology domain.
Research Methodology Documents Topic Similarity Visualization Topics Topic Relation Analysis Keyword Extraction Arizona NounPhraser SOM Algorithm Research Methodology (cont.) • Use content maps to study the active research topics and their relations in different time spans. • Technology topics are extracted from the papers’ abstracts using the Arizona Noun Phraser (Tolle and Chen, 2000). The topics are organized by the multi-level self-organization map algorithm (Chen et al., 1996; Ong et al., 2005), which positions similar topics closer together according to their co-occurrence patterns.
Research Methodology Country Citation Network Documents Topological Analysis Visualization Paper Citation Relationships Institution Citation Network Citation Aggregation CitationExtraction Core Network Extraction Research Methodology (cont.) • Use citation network analysis to study knowledge spillover patterns between countries/regions and between institutions. • Using network topological measures to infer the global characteristics of knowledge spillover in the nanotechnology field (Li et al., forthcoming). • Visualize the core citation network and identify the important patterns in the network: • citations.
Dataset Data: Thomson SCI Nanotechnology Papers, 1976-2004 • Paper collections • 213,847 papers • 120,687 first authors • 24,468 institutions • 4,175 journals/conferences • 156 countries/regions • The identifiers of the papers that cited or were cited by the nanotechnology papers are also retrieved.
I. Bibliographic Analysis Bibliographic Analysis
I. Bibliographic Analysis Papers by Country/Region • Top 20 countries/regions based on number of papers published from 1976 to 2004 (log scale)
I. Bibliographic Analysis Papers by Country/Region (cont.) • Top countries/regions (without USA) based on number of papers published from 1976 to 2004 (normal scale)
I. Bibliographic Analysis Papers by Institution • Top 20 institutions based on number of papers published from 1976 to 2004 (normal scale)
Dataset Data: Productive Countries • Top 20 countries/regions based on number of papers published from 1976 to 2004
Dataset Data: Productive Institutions • Top 20 institutions based on number of papers published from 1976 to 2004
II.Content Map Analysis Content Map (1990-1999)
II.Content Map Analysis Findings • Nanotechnology papers published between 1990 and 1999 covered the topics related to • Tools • E.g., “Scanning Tunneling Microscope,” “Transmission Electron Microscopy,” “Atomic Force Microscope,” and so forth. • Physical phenomena • E.g., “Quantum Dots,” “Single Crystals,” “Self-Assembled Monolayers,” “Nanomolar Concentrations,” “Porous Silicon,” “Surface Morphologies,” and so forth. • Experiment environments • E.g., “Electric Fields,” “Room Temperatures,” “X-Ray Diffraction,” “Temperature Dependences,” “Activation Energies,” and so forth.
II.Content Map Analysis Content Map (2000-2004) -1.51-0.300.330.811.23 1.632.05 2.53 3.163.624.37 NEW REGION
II.Content Map Analysis Findings • Nanotechnology papers published between 2000 and 2004 also covered the topics related to tools (e.g., “Scanning Tunneling Microscopy,” “Transmission Electron Microscopy,” “Atomic Force Microscope”), physical phenomena (e.g., “Quantum Dots,” “Self-Assembled Monolayers”), and experiment environments (e.g., “Aqueous Solution,” “X-Ray Diffraction”). • The topics on experiment environments became less active compared with the other two kinds of topics. • There were some new topics like: “X-Ray Photoelectron Spectroscopy,” “Single-Wall Carbon Nanotubes,” “Carbon Nanotubes,” “Monte Carlo Simulations,” and “Chemical Vapor Deposition.”
III.Citation Network Analysis Country Citation Network (1976-2004) • The country citation network (1976-2004) consists of • 66 countries, • 348 inter-country citation relations, and • 9 self-citation relations. • The country citation network contains one component. • Different countries’ knowledge influences each other directly or indirectly. • Much larger clustering coefficient (0.693) than the random network (0.162). • Some countries tend to form communities from thepaper citation perspective.
III.Citation Network Analysis Country Citation Network (1976-2004)
III.Citation Network Analysis Institution Citation Network Analysis • The institution citation network consists of • 1,237 institutions, • 3,075 inter-institution citation relations, and • 7 self-citation relations. • The institution citation network consists of 20 components. The giant component contains 1,185 (95.8%) institutions and 3,041 (98.9%) relations. • Most institutions interact with others directly or indirectly. • Smaller average path length (4.050) than the randomnetwork (4.440). • Knowledge can very easily transfer between institutions. • Much larger clustering coefficient (0.069) than the random network (0.004). • Research institutions have a very high tendency to form citation clusters.
III.Citation Network Analysis Institution Citation Network (1976-2004)
Papers by Year • The number of papers published from 1976 to 2007.
Essential Institutions • Top 10 institutions based on number of papers published from 1976 to 2004.
Most Productive Researchers • Top 10 first authors based on number of papers published from 1976 to 2004.
Most Cited Researchers • Top 10 first authors according to the number of cites received from all papers in SCIfrom 1976 to 2004.
Take-home Messages • Studying international competitive landscape: knowledge and innovations • The power of the automated knowledge mapping approach • Prioritized national nanotechnology research programs and directions • Turning academic research (literature) into patents and commercial products • Commercialization directions and priorities
Hisinchun Chen, Ph.D. hchen@eller.arizona.eduArtificial Intelligence LabUniversity of Arizonahttp://ai.arizona.edu