Download
1 / 20
210 likes | 390 Views
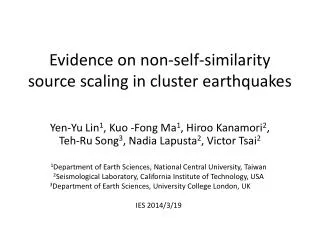
Evidence on non-self-similarity source scaling in cluster earthquakes. Yen-Yu Lin 1 , Kuo -Fong Ma 1 , Hiroo Kanamori 2 , Teh-Ru Song 3 , Nadia Lapusta 2 , Victor Tsai 2.

E N D
Evidence on non-self-similarity source scaling in cluster earthquakes Yen-Yu Lin1, Kuo -Fong Ma1, Hiroo Kanamori2, Teh-Ru Song3, Nadia Lapusta2, Victor Tsai2 1Department of Earth Sciences, National Central University, Taiwan2Seismological Laboratory, California Institute of Technology, USA 3Department of Earth Sciences, University College London, UK IES 2014/3/19
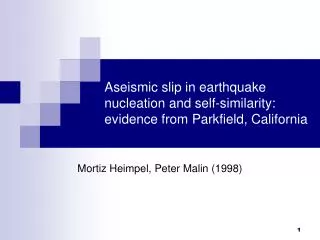
Earthquake self-similarity???? Seismic waveforms Source time function Dimension (Circular) Smaller earthquake r1 Constant rupture speed Larger earthquake shorter P-dur Similar Q structure r2 longer P-dur (Aki, 1967)
Cluster A Cluster with constant P-durations 0.27 P-phase durations Pdur = 0.07s (~15Hz)Magnitude variationMwe 0.27 to 1.97 Filter: Notch filter 60Hz 1.97
TCDP Borehole seismometers Instrument response Natural frequency: 4.5Hz Damping: 0.29 Gain: 100 Sampling rate for analysis 1000 p/s before 2008 (Nyquist frequency 500Hz) 200 p/s after 2008 (Nyquist frequency 100Hz) Corrections before analysis- Instrument response- Galperin angle - Orientation (Lin et al., 2012)
Earthquake Clusters • 2006/11~2007/12 (14 months)- Correlation coefficient (3 comp.) > 0.8 • 130 clusters (2~11 events) • Mwe 0.0~2.0 (S-wave max. amp.)- Located 7 clusters (A-G) (> 4 events) by stacked waveforms
Seismic clusters- finite P duration 0.27 0.49 0.35 1.97 1.62 1.32
Analysis 2 : Futterman Q correction (Futterman, 1962) Observed velocity spectrum: For event a and b with receiver k within a cluster, Bak(f)=Bbk(f) Analysis 1 : Empirical Green’s function (Wang et al., 2010; 2012)
Analysis 1 : Empirical Green’s function Power of 0.04(1/20)~0.10(1/10) Tw=0.010~0.024 s Source dimension=20~50m
Analysis 2 : Futterman Q correction Q=202 Q=101 Q=202 & Q=101 Tw=0.020~0.054 s (a constant for each cluster)Source dimension=40~110m
Source scaling for the clusters Power of 0.04(1/20)~0.10(1/10) Comparison to earthquake self-similarity empirical relation (9.2>M>6.5) (Duputel et al., 2013) Clusters with the constant P-wave durations observations break down the earthquake self-similarity behavior.
Constant rupture speed “a characteristic length “
Rupture speed and source dimension It can be constrained by source time function estimations. If α=1/3, earthquake self-similarity!But, selection of α can be arbitrary! • Any specified α could also be another possible model to explain the unique observations.
Summary • We discovered 3 clusters with constant P-phase durations (Pdur) for events Mw 0.5 to 2.0 in TCDPBHS records, which had been shown to be natural events from deformed zone of decollement. • The constant P-phase durations observations in the clusters break down the earthquake self-similarity behavior of Tw ∝ Mo(1/3)as examined by both the empirical Green’s function and Futterman Q correction analyses based on assumption of a constant rupture speed. • A potential model to explain the constant Pdur phenomenon is an existence of a characteristic length on the fault, limiting the duration of the source time function. • The difference in high frequency component between smaller and larger events might be due to the heterogeneity of fault. • If not characteristic length related, another possibility is the significant difference in rupture speed among the cluster events.