Download
1 / 13
130 likes | 386 Views
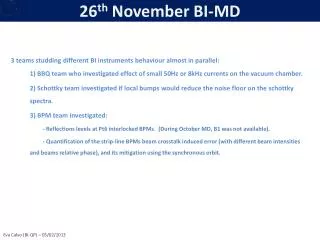
26 th November BI-MD. 3 teams studding different BI instruments behaviour almost in parallel: 1) BBQ team who investigated effect of small 50Hz or 8kHz currents on the vacuum chamber. 2) Schottky team investigated if local bumps would reduce the noise floor on the schottky spectra.

E N D
26th November BI-MD 3 teams studding different BI instruments behaviour almost in parallel: 1) BBQ team who investigated effect of small 50Hz or 8kHz currents on the vacuum chamber. 2) Schottky team investigated if local bumps would reduce the noise floor on the schottky spectra. 3) BPM team investigated: - Reflections levels at Pt6 interlocked BPMs. (During October MD, B1 was not available). - Quantification of the strip-line BPMs beam crosstalk induced error (with different beam intensities and beams relative phase), and its mitigation using the synchronous orbit.
50Hz and 8 kHz investigation using the BBQ Excitation on the tune resonance (3120 Hz, red) 50Hz and 8kHz harmonic lines Excitation tune off-resonance (3090 Hz, green) Spectra without excitation (blue) The aim was to assess whether small fault currents that pass along the vacuum chamber are sufficient to induce minute 50Hz or 8kHz oscillation of the beam. To experimentally verify this hypothesis, we installed two taps on the right side of Pt4 onto the B2 vacuum chamber during an earlier TS. The distance between the taps is about 10 metres and the maximum estimated current is about 50 mA r.m.s. Due to (normal) instrumental effects, the excitation is pick-ed up by the BBQ systems on the right of Pt4 even without beam. However, these are not seen by the BBQ systems one the left side (a few hundred metres apart). Exciting on off- and on-resonance of the horizontal tunes we could observe signal levels similar to those generated by the 50 Hz lines.
Effect of local bumps in the schottky spectra Schottky bands Improvement of the schottky spectra, by introducing local bumps (-1.5mm in B1V) and this way reducing the common mode signals. This reduced the noise floor, and allowed to better detect the schottky bands.
BPM : machine setup and procedure • Fillingscheme used: Bunches overlapping and no overlapping at BPMSW.1R1 (1R5). • Procedure: • Make a sweep of the relative phase between B1 and B2, so that we find a maximum error at the BPMSW monitors. • In LOW SENSITIVITY scrap B1. And at several intensity levels change the bunch ID mask of the synchronous orbit to observe the effect. • Change to HIGH SENSITIVITY, and repeat the measures while observing in parallel the interlocks behaviour. • Then repeat, scrapping B2 this time. Switch B2 BPMs sensitivity Beam intensity Switch B1 BPMs sensitivity time
Scrapping overview • Collimator scrapping much faster than initially pretended. • Little number of levels and not very flat.
B1 and B2 scrapping. BPM Interlock results (I). B2 scrapping B1 scrapping FBCT data missing! Average Orbit Average Orbit Low sensitivity High sens. Low sens. High sens. Avg. Number of bunches Avg. Number of bunches ~ 20 minutes ! Transitions! 1st zoom 2nd zoom 4thzoom 3rd zoom The aim of this kind of experiment is to analyze the bunch intensities at which state transition happens (bunches that have reflections, or that become to small to be detected by the system).
B1 and B2 scrapping. BPM Interlock results (II). • Scrapping with the collimators did not provide enough control on the bunch intensity of every bunch. • B1 was a bit too fast, only 20 minutes for both ranges (less than 10min in low sensitivity and even less in high sensitivity). As consequence, B1 bunches were already too weak when we switched to high sensitivity, and the reflections were not observed. • We did the B2 scrapping a bit slower and we switch to high sensitivity earlier (a few bunches still had 5e10p). Reflections were then observed, and the intensity at which reflections and bunch signals were not detectable anymore by the system quantified. This time we could see that the channels did not transited at the same time. • However, the poor granularity of the FBCT data (only 1 point logged per bunch every minute) makes very difficult to calculate the charge of every bunch when transitions happened. And for some bunches and time periods data was missing. • The “detection level” corresponds to a clear transition in the number of bunches acquired by the system, and it is more clear to identify that the level at which interlocks will trigger a dump (the latest would require a bunch-by-bunch logging that is not available). • In low sensitivity mode, the detection level seemed to be around 1.5e10p/bunch (first scrapping) and about 2e10p/bunch (second scrapping). • In high sensitivity, the transitions happened too fast and there are only two points available from FBCT. So, it is hard to say (5-7e8 p/bunch). • The orbit drifts (that happen when one bunch was close to the detection threshold ) seem to be smaller in low sensitivity than in high sensitivity. • 1st transition in low sensitivity produced a drift of ~1mm. The second, about 2mm. And the 3rd one, ~4mm (> interlock margins). (Averaging effect) • Drifts in high sensitivity were very large (>6mm).
Synchronous orbit. Analysis. BPMSW.1L1 B1, bunch 101 B2, bunch 107 B2 moved by 5x50° B1, bunch 101 overlapping with B2 bunch 107. BPMSW.1R1 Initial conditions Figures show oscilloscope screenshots of fibre signals where we have overlaped B1 and B2 sum signals. With the chosen filling scheme, B1 bunch ID 101 and B2 bunch ID 107 overlap at BPMSW.1R1 and BPMSW.1R5, but they are separated at BPMSW.1L1 and BPMSW.1L5 (by close to 12 bunch slots). We modify the relative phase between B1 and B2 to measure the maximum error that this B1-B2 overlapping causes.
Synchronous orbit: B1-B2 relative phase sweep P1 B1-B2 relative phase(ns) B1-B2 relative phase(ns) B1-B2 relative phase(ns) B1-B2 relative phase(ns) 350 um 300 um 150 um 140 um
Synchronous orbit: B1-B2 relative phase sweep P5 B1-B2 relative phase(ns) B2, 550 um B1-B2 relative phase(ns) B2 ~350 um B1 <100um 140 um ~50 um B1, 250 um B1-B2 relative phase(ns) B1-B2 relative phase(ns)
Synchronous orbit: Bunch ID mask effect before the scrapping Analysis of the bunch ID mask effect in the synchronous orbit still undergoing. Bunch ID mask changes