Download
1 / 6
60 likes | 193 Views
EXAMPLE 1. Write and graph an inequality. Death Valley. The highest temperature recorded in the United States was 134 F at Death Valley, California, in 1913 . Use only this fact to write and graph an inequality that describes the temperatures in the United States. SOLUTION.

E N D
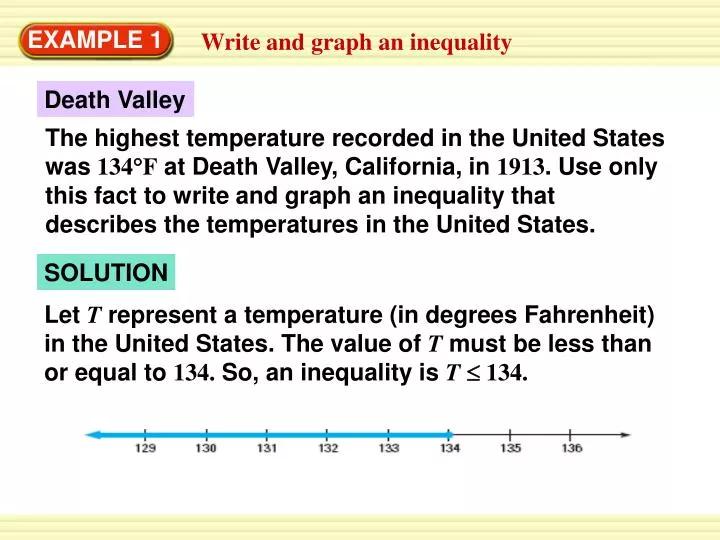
EXAMPLE 1 Write and graph an inequality Death Valley The highest temperature recorded in the United States was 134F at Death Valley, California, in 1913. Use only this fact to write and graph an inequality that describes the temperatures in the United States. SOLUTION Let Trepresent a temperature (in degrees Fahrenheit) in the United States. The value of Tmust be less than or equal to 134. So, an inequality is T 134.
a. a. The open circle means that –6.5 is not a solution of the inequality. Because the arrow points to the right, all numbers greater than –6.5 are solutions. ANSWER An inequality represented by the graph is x > –6.5. EXAMPLE 2 Write inequalities from graphs Write an inequality represented by the graph. SOLUTION
b. b. The closed circle means that 4 is a solution of the inequality. Because the arrow points to the left, all numbers less than 4 are solutions. ANSWER An inequality represented by the graph is x 4. EXAMPLE 2 Write inequalities from graphs SOLUTION
ANSWER x –129F for Example 1 and 2 GUIDED PRACTICE Antarctica The lowest temperature recorded in Antarctica was –129F at the Russian Vostok station in 1983. Use only this fact to write and graph an inequality that describes the temperatures in the Antarctica.
ANSWER x<8 for Examples 1 and 2 GUIDED PRACTICE Write an inequality represented by the graph.
ANSWER x –2.5 for Example 1 and 2 GUIDED PRACTICE Write an inequality represented by the graph.